Jump to section
ANPR traffic flow map showing vehicles flowing around Southville, not through it

Independent Analysis of the South Bristol Liveable Neighbourhoods Traffic Survey Data

Ali Bin Shahid · April 2026 · Updated 7 May 2026 · Based on SBLN 2024 Traffic Survey Results

0.07%
cross-zone traffic detected
Updated · 14 May 2026 · master + two audits Three documents now available: the consolidated master reference (v1.4), plus two standalone audits drawn from it (SBLN through-traffic, 20 mph speed-limit consultation). All numbers in one Excel database. Jump to downloads ↓
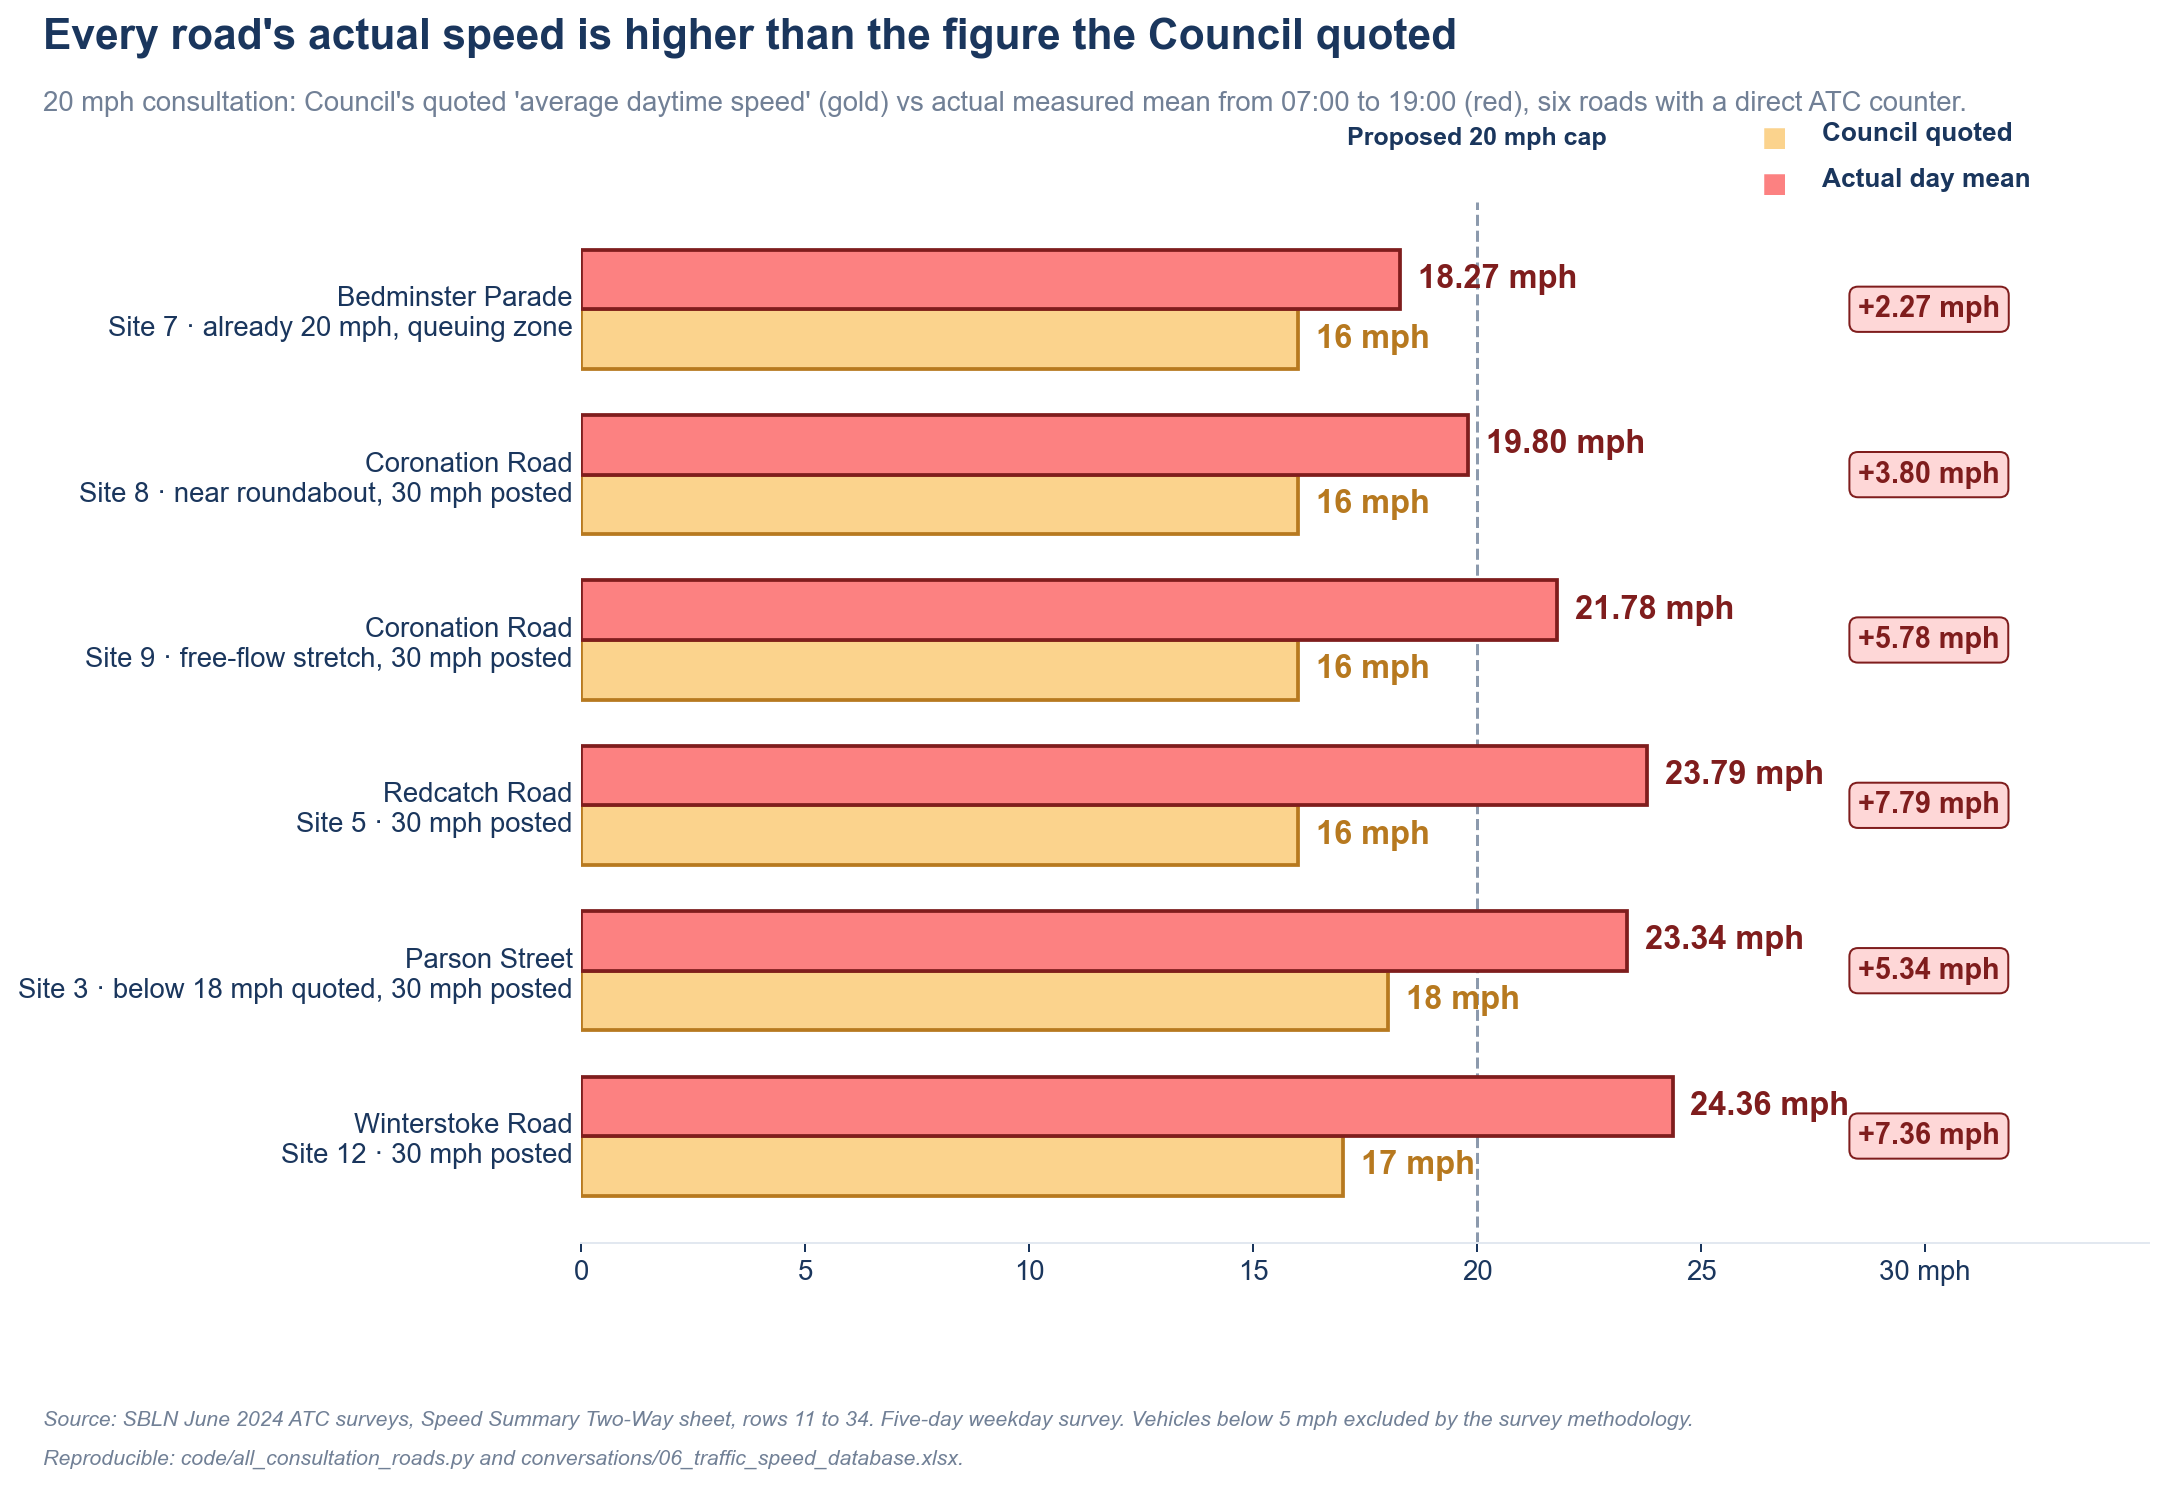
Bar chart comparing the Council's quoted average daytime speeds against the actual measured day-mean and 85th-percentile speeds on six consultation roads. Every actual speed is between 3.8 and 7.8 mph higher than the Council's quoted figure.

The 20 mph consultation: every road where the Council has its own counter shows an actual mean speed between 3.8 and 7.8 mph above the figure they quoted. Source: SBLN June 2024 ATC surveys.

Report v1.4 · 14 May 2026

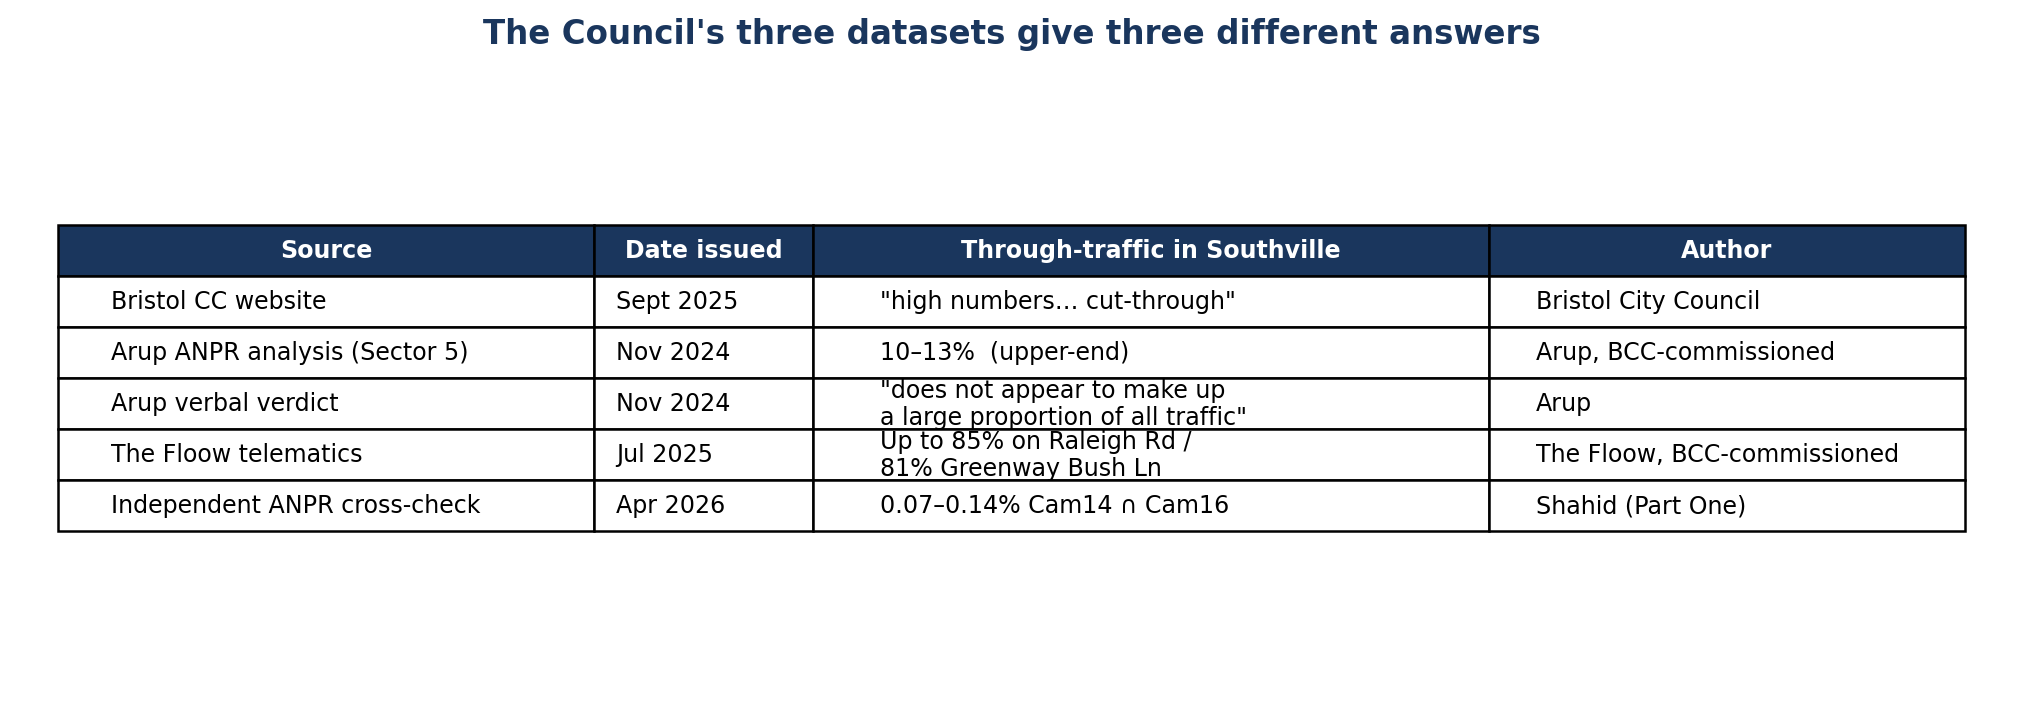
Three Council datasets, three different answers, none supporting "high numbers".

After media coverage on 6 to 7 May, Bristol City Council published a tranche of additional traffic material on its SBLN page. Read carefully against its own documents, none of it supports the claim that vehicles cut through Southville in high numbers. What the Council itself paid for says the opposite.

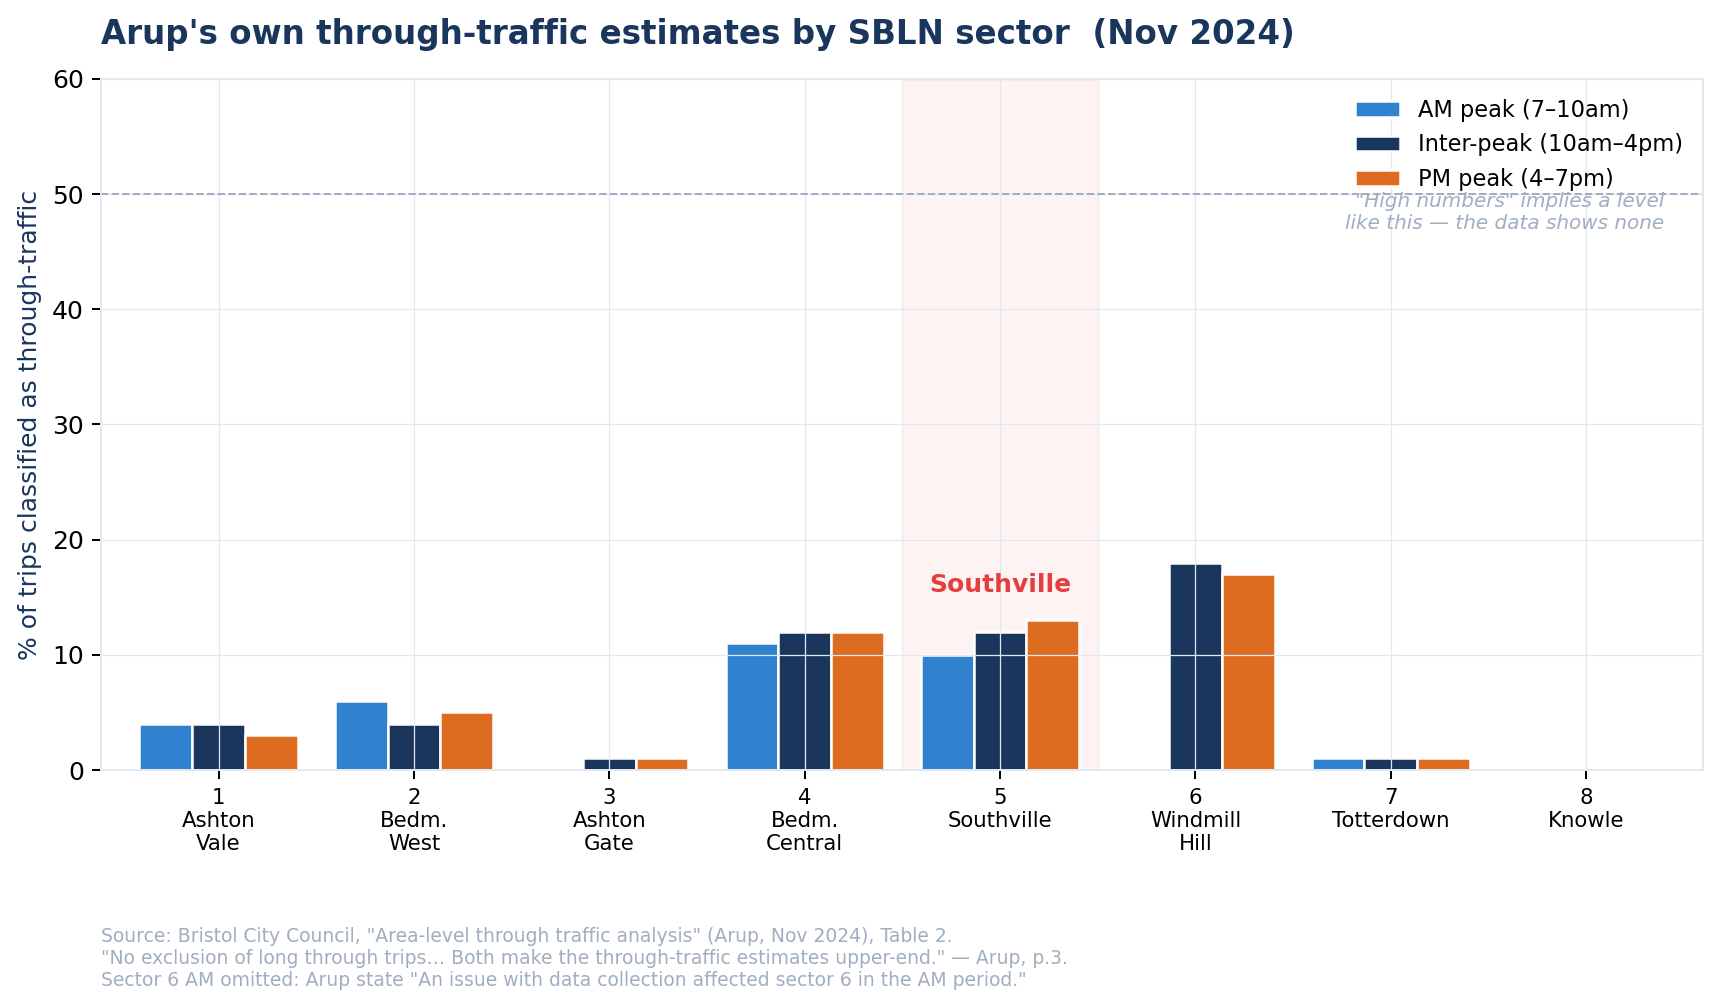
10 to 13% The Council's own consultant (Arup, Nov 2024) put Southville through-traffic at 10 to 13%, marked as an upper-end estimate, with the verdict that "through-traffic does not appear to make up a large proportion of all traffic". The analysis was withheld from public-forum responses for 17 months.
53% Floow's hourly figures sum to just 53% of what the Council's own pneumatic-tube counts physically recorded on the same streets in the same hours (86 matched sites, Weekday PM peak). On the busiest road, Floow reports 3% of the cars the tubes counted.
45.5% Of 1,077 physical road segments where Floow reports values for ≥2 of its 5 time windows, 45.5% swing by ≥30 percentage points across the day. The metric is unstable across time of day on the same road.
0.07% Independent ANPR cross-check (Part One): only 10 to 11 vehicles per day were detected at both Camera 14 and Camera 16, the two cameras nearest the Southville Zone. That is 0.07 to 0.14% of traffic at those cameras.
14 Seventeen documented inconsistencies between what the Council says in public and what the Council's own data actually contains. Every claim sourced. The full list is below.

Every quantitative claim on this page traces to a Council-published file or to public-domain analysis you can reproduce. See the eighteen inconsistencies ↓ · The parallel 20 mph consultation ↓ · Open the live data explorer →

The Council's own consultant said this, verbatim

"Whilst there is some variance across the study area, at a sector level through-traffic does not appear to make up a large proportion of all traffic." Arup Through Traffic Analysis · Nov 2024 · p. 3
"No exclusion of 'long' through trips… or of mismatches… Both of these exclusions make the through-traffic percentage estimates upper-end estimates." Arup Through Traffic Analysis · Nov 2024 · p. 3

Seventeen documented inconsistencies

Each row pairs a Council claim or data point with what the Council's own documents actually say, and the source file you can check.

The Council says…
The Council's own data says…
Source you can check
1
"High numbers of vehicles from outside the area use residential streets in Southville as a cut-through to other destinations."
Arup's own number for Sector 5 (Southville) is 10 to 13%, and Arup themselves call it an "upper-end estimate" that "does not appear to make up a large proportion of all traffic".
Arup Through Traffic Analysis.pdf · pp. 1, 3
bristol.gov.uk/.../10865-arup-through-traffic-analysis
2
Two consultancies were paid to measure "through traffic". The same word, used in public communications, must mean the same thing.
Arup defined through as "trips not made by residents or visitors". Floow defined it as "trip endpoints both outside the local zone polygon". They are not the same metric. The Council never tells readers which one a given percentage is measuring.
Arup Through Traffic Analysis.pdf · p. 1 (glossary)
floow_all.geojson · field percent_through
3
The Floow map shows percentages "by SBLN zone".
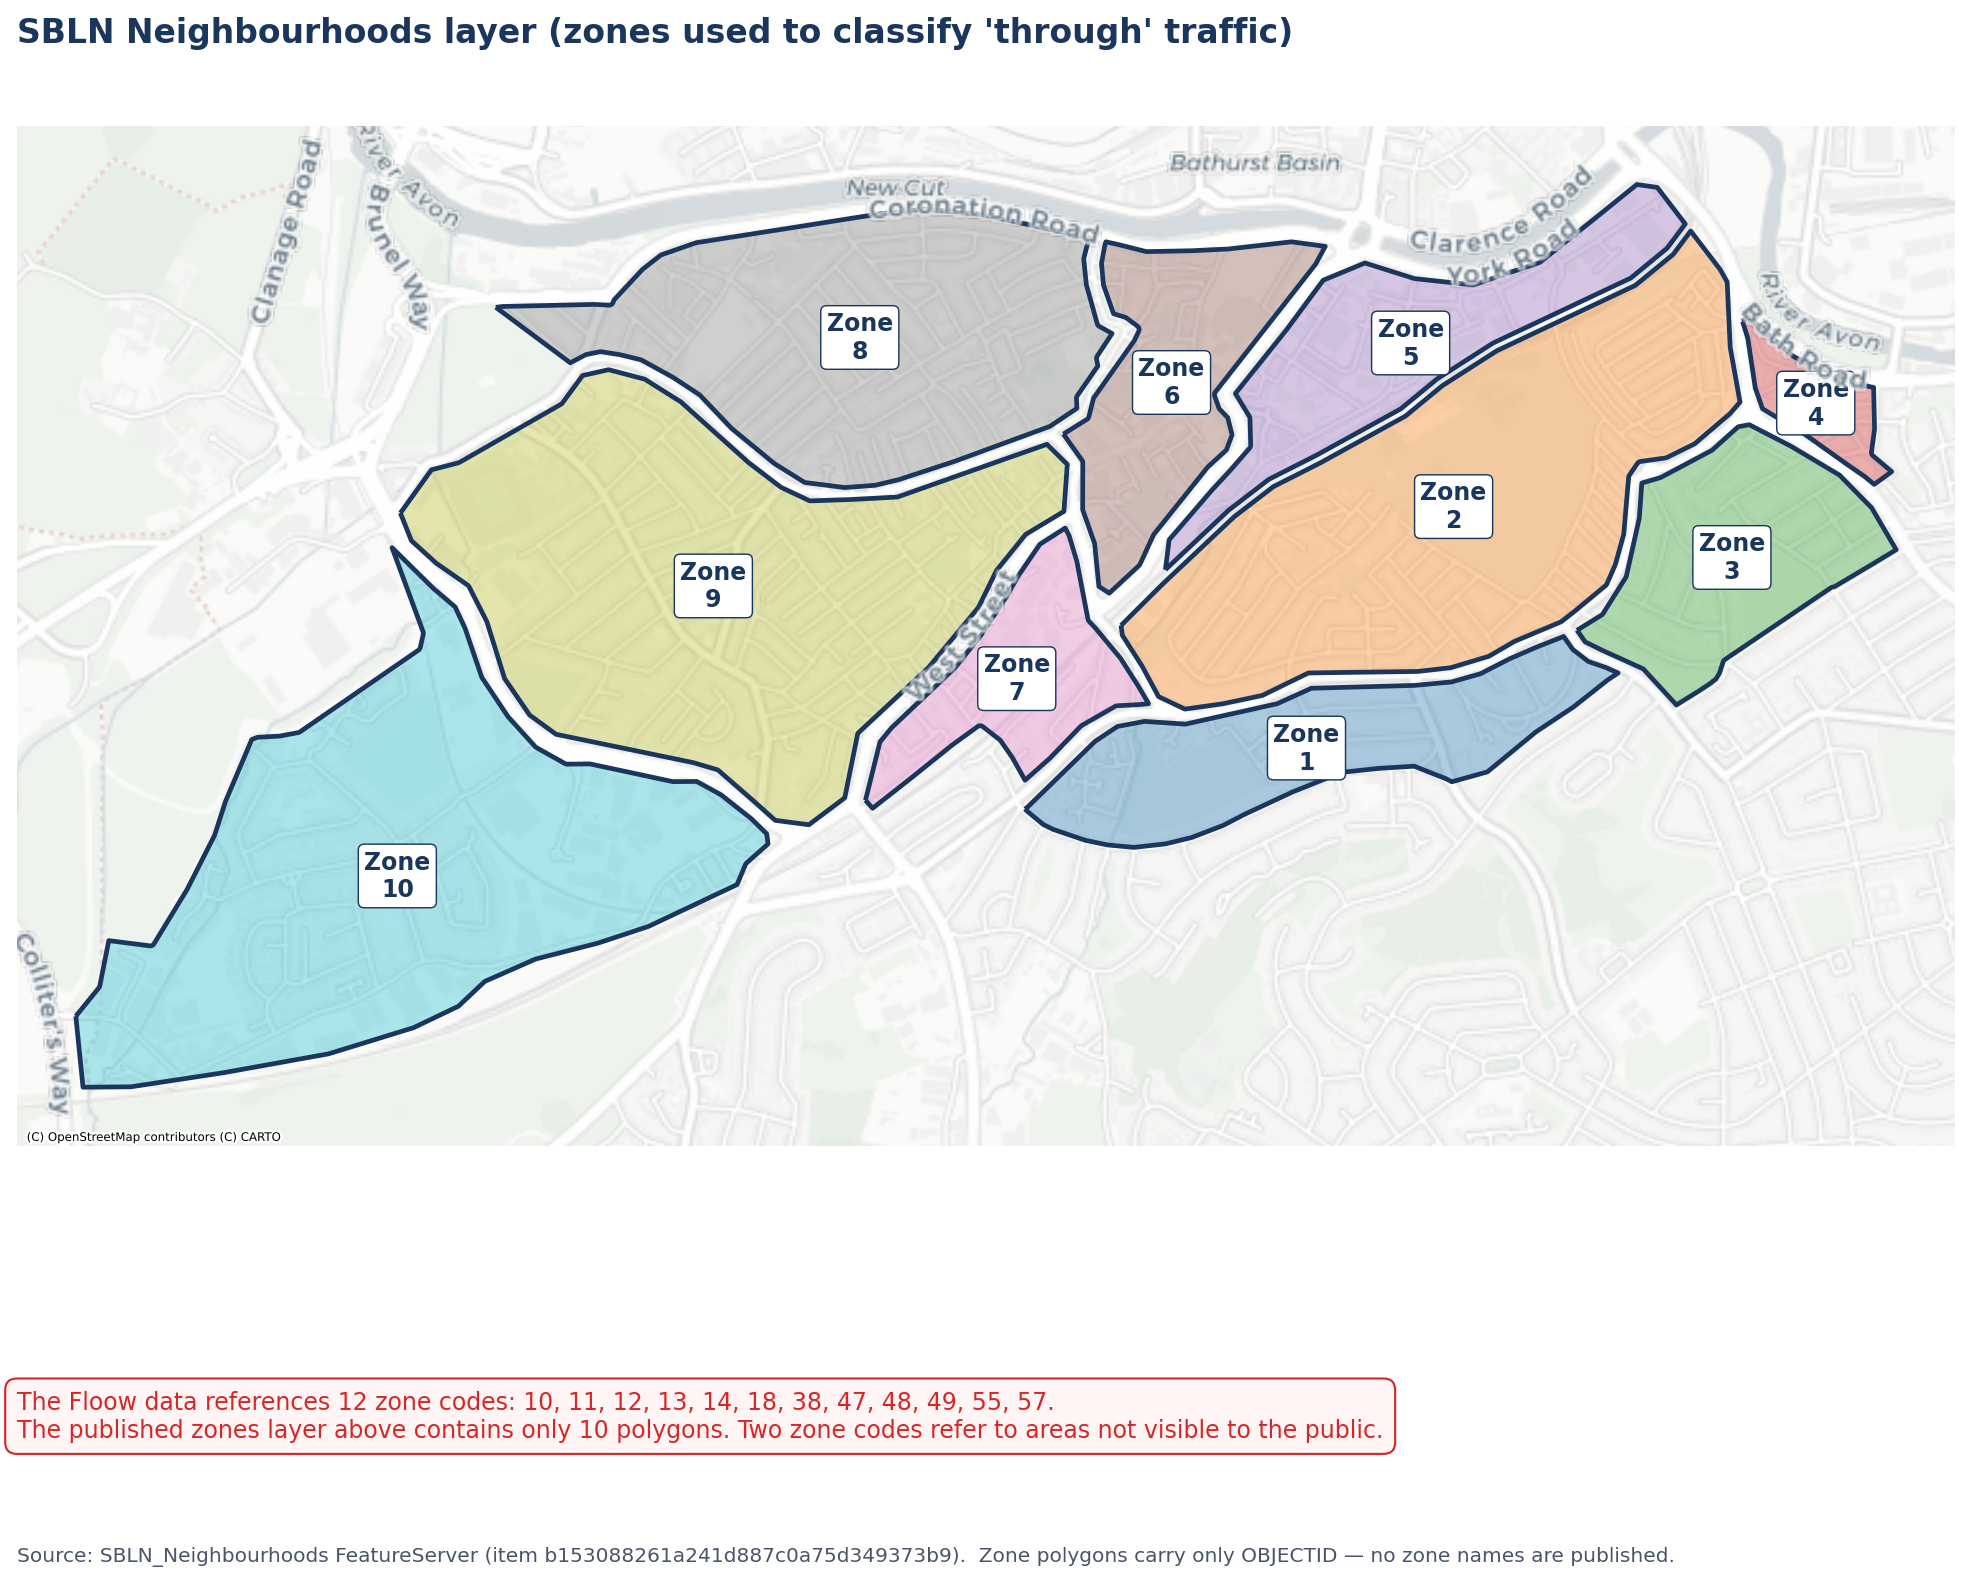
The dataset references 12 zone codes; only 10 zone polygons are published. Two zones used to classify trips are not visible to the public.
floow_all.geojson field od_region ∈ {10, 11, 12, 13, 14, 18, 38, 47, 48, 49, 55, 57}
sbln_zones.geojson · 10 features
4
"The SBLN" is a coherent area divided into "modal-filter zones".
The Council's own documents use three different zone systems: Arup's 8 sectors, Floow's 10 to 12 zones, and the engagement material's 4 modal-filter zones. There is no published cross-walk; a Southville percentage is not the same area as a Sector 5 percentage.
Arup Through Traffic Analysis.pdf · Figure 1
sbln_zones.geojson
BD17291 - SBLN Engagement Report A4_a_v8.pdf
5
Floow data is shown "by neighbourhood".
The published zone polygons carry no name field, only an integer OBJECTID. A resident cannot tell which neighbourhood their own address belongs to, and therefore cannot tell whether a given through-traffic claim is even about their road.
sbln_zones.geojson · attributes: OBJECTID, Shape__Area, Shape__Length
6
"The values for each time of day are averaged across the period September 2024 to May 2025."
Only 5 time-windows are present: weekday AM peak, weekday PM peak, weekend AM peak, weekend midday, weekend PM peak. No weekday inter-peak, no weekday evening, no overnight. Any "the data shows X%" claim is a peak/weekend statement, not a 24-hour one.
floow_all.geojson · field day_time · 5 distinct values
7
"…where there is a sufficient sample size."
Some segments report 100% through-traffic, which under any sample-size filter implies zero local trips on the segment. The "sufficient sample size" threshold is not published. The dataset also contains duplicate rows for the same segment-bearing-period with identical attributes but different Shape__Length, so naïve length-weighted averages will double-count.
floow_all.geojson · 4,866 features ↔ 2,963 unique segment_ids
OBJECTIDs 3 and 4 (same segment_id 9, identical fields, lengths 60.78 m vs 57.12 m)
8
"December 2025 Traffic Surveys".
The Council page says December 2025; the underlying ArcGIS layer name says Autumn 2025 (RequestName 2025-10-30-SBLN-before-counts-Autumn-2025); the spreadsheet filenames inside the zip say "Nov 25". Three different labels for the same dataset.
SBLN-December-2025-Traffic-Surveys.zip
sbln_traffic_count_extents_autumn2025.geojson
9
The "December 2025" surveys help support the through-traffic claim.
The dataset has no through-traffic field. It records 7-day average vehicle volume, mean speed, 85th-percentile speed, walking, cycling, and nothing else. By construction it cannot say anything about through-traffic.
sbln_traffic_count_extents_autumn2025.geojson · 7 attribute fields, none of them through-traffic
10
The "December 2025" surveys help justify the September 2025 statement.
The data was collected in October to November 2025, after the Council had already made the September 2025 claim. Even if it had a through-traffic field, it could not retroactively support a claim made before it existed.
SBLN-December-2025-Traffic-Surveys.zip · spreadsheet filenames tagged "Nov 25"
11
"We have published all the relevant evidence." (Implied in repeated public-forum responses through 2025 and early 2026.)
The Arup November 2024 analysis, the most directly relevant document, addressing the exact question, was withheld from public-forum responses for 17 months and surfaced only in late April 2026, after media coverage forced the issue. Separately, the Floow telematics map covering data through May 2025 was not published as an ArcGIS Online item until 27 April 2026 — almost a year after the data-collection window closed.
Arup Through Traffic Analysis.pdf · Nov 2024, first cited late April 2026 · Floow ArcGIS item 701b8df988cf4480b9d80522f3f81a01 created 27 April 2026
12
"High numbers" justify physical street closures across Southville.
The single highest absolute through-traffic count Arup identifies anywhere in the SBLN study area is 229 vehicles per AM peak on Palmyra Road westbound, about 1.3 vehicles per minute, in a different sector (Sector 4, Bedminster Central). Not "high numbers", and not Southville.
Arup Through Traffic Analysis.pdf · Table 1, p. 2
13
Floow's per-segment %through is a stable property of the road.
It isn't. Of 1,077 physical road segments where Floow reports values for ≥2 of its 5 time windows, 45.5% swing by ≥30 percentage points in percent_through between any two periods, and 15.4% swing by ≥50 points. Median swing across the day on the same road is 28 points. Examples: one segment goes 22.9% (WD AM) → 85% (WD PM); another 81% (WD AM) → 19.8% (WD PM). The same physical road, the same direction, swings of 60+ percentage points across the day. A measurement that fluctuates this much cannot be a property of "through traffic"; it is sample noise plus algorithm artefacts at the polygon boundary.
floow_all.geojson · 1,077 multi-period segments matched on (lat, lon, bearing). Reproducible from code/dataset_deep_dive.py.
14
Floow's estimatedCarsPerHour is the actual vehicle count on each segment.
It is not, it's an estimate from a sample of vehicles whose sample rate is unpublished. Cross-checked against the Council's own pneumatic-tube ATC counts on 86 matched streets in PM peak: Floow's hourly figures sum to 53% of what the tubes physically counted. Site-level ratios range from 0.03 (Floow undercounts BCC-583 by 33×, on a road carrying 12,509 vehicles/day) to 3.4 to 3.6 (Floow overcounts BCC-538, BCC-683, BCC-609 on quiet residential streets by 3 to 4×). The disagreement is structural, not noise: Floow systematically undercounts on busy main roads (sample-rate effect) and overcounts on quiet residential streets (extrapolation artefact).
floow_all.geojson vs sbln_traffic_count_extents_autumn2025.geojson. Cross-check in code/floow_vs_atc_crosscheck.py; results CSV at code/floow_vs_atc_crosscheck.csv.
15
"The average daytime speed along this section is 16 mph. This means a 20 mph limit should improve safety without adding to journey times." (20 mph consultation, Coronation Road and Clift House Road entry, and near-identical wording on Redcatch Road, Parson Street, Bedminster Down Road and Winterstoke Road.)
The 16 mph figure does not reproduce on any Council ATC counter we checked. On every consultation road with a direct counter, the actual mean daytime speed (07:00 to 19:00) is between 3.8 and 7.8 mph higher than the quoted figure. The 85th-percentile speed, one of the two commonly used measures listed in DfT Circular 01/2013 paragraph 36, is between 24.0 and 29.2 mph on every road; the Council have published neither the mean nor the 85th-percentile in DfT-aligned form. Between 38% and 85% of daytime vehicles on these roads are currently above 20 mph and would be slowed by the cap, contradicting the "no effect on journey times" claim.
2024 ATC speed-summary spreadsheets in data/SBLN 2024 Traffic Survey Results/ATC surveys/. Cross-check in code/all_consultation_roads.py; results in sheet Consultation_compare of the Excel database.
16
The 20 mph consultation states an "average daytime speed" for approximately 100 roads across Bristol, in the 16 to under-18 mph range.
No consultation page checked cites an ATC site number, survey date or methodology document for any road. For four roads that overlap our SBLN data set (Clift House Road, Bishopsworth Road, Bedminster Down, Bedminster Down Road) we can also confirm there is no matching counter in the published SBLN dataset. For the remaining roads the absence of source citation makes the figures unverifiable in either direction. The Council are making numerical claims about ~100 roads without publishing the supporting data for any of them.
Bristol City Council 20 mph consultation pages (bristol.gov.uk/20mph and consultation hub id=281), all areas checked. No matching counter found for the four SBLN-overlap roads in data/SBLN 2024 Traffic Survey Results/ATC surveys/.
17
Arup's 10 to 13% Sector 5 (Southville) through-traffic figure remains a current published Council figure.
Arup computed that figure against a Sector 5 perimeter along East Street and Bedminster Parade in November 2024, with Dean Lane inside the sector. The September 2025 SBLN consultation map redrew the perimeter along Dean Lane, putting Dean Lane on the boundary. Trips on Dean Lane that crossed the November 2024 perimeter and counted as through-traffic cease to be through-traffic under the new geometry. Arup's 10 to 13% has not been recomputed and is still cited. JTC Site 6 (Dean Lane south end) recorded 2,486 vehicles in the AM peak alone on 11 June 2024, approximately 3.78 times Arup's entire Sector 5 through-traffic count for the same period.
Arup Through Traffic Analysis.pdf · Figure 1 (sector map); September 2025 SBLN consultation map. JTC Site 6 spreadsheet in data/SBLN 2024 Traffic Survey Results/JTC surveys/; calculation in code/dean_lane_calculation.py.
18
The Floow interactive map is the Council's central evidence for the "high numbers" cut-through claim.
The Floow ArcGIS Online item (701b8df988cf4480b9d80522f3f81a01) was not created until 27 April 2026. The item title is TheFloow_though_traffic_SBLN_Sep24_May25, so the underlying data collection ended in May 2025. The Council held the map for approximately 11 months before publishing it, and only released it in the same week as the Arup analysis, after media coverage.
ArcGIS item JSON at arcgis.com/sharing/rest/content/items/701b8df988cf4480b9d80522f3f81a01?f=json, created timestamp 1777290791000 (= 2026-04-27 14:33 UTC).
Same pattern · Parallel consultation closing 17 May 2026

The Council is doing it again, on a different consultation, with the same data.

In parallel with the SBLN scheme, Bristol City Council is consulting on 20 mph speed limits for around 100 roads, closing 17 May 2026. For each road, the consultation page asserts an "average daytime speed" (16, 17 or 18 mph) and uses it to claim "a 20 mph limit should improve safety without adding to journey times." The reasoning is statistically false. The numbers themselves do not reproduce on the Council's own ATC counters.

"The average daytime speed along this section is 16mph. This means a 20mph limit should improve safety without adding to journey times." Bristol City Council 20 mph consultation, Coronation Road / Clift House Road entry

Average means the centre of a distribution. A 20 mph cap slows every vehicle currently above 20. Their journey times rise. Nobody's falls. We checked every consultation road that has a direct counter in the SBLN ATC dataset, including the slowest, most queue-affected, already-20-mph site (Site 7, Bedminster Parade), which is the Council's strongest possible defence. Even there, the figure does not match.

Road and ATC site
Council quote
Day mean
24h mean
85th %ile
Bedminster Parade, Site 7already 20 mph, queuing zone, the Council's best case
(implied 16 mph)
18.79
19.32
23.4
Coronation Rd, Site 8near roundabout, currently 30 mph
16 mph
20.30
21.11
26.0
Coronation Rd, Site 9long free-flow stretch, currently 30 mph
16 mph
22.23
23.40
28.4
Redcatch Rd, Site 5currently 30 mph
16 mph
24.07
24.47
29.1
Parson Street, Site 3currently 30 mph
below 18 mph
23.06
23.76
28.6
Winterstoke Rd, Site 12currently 30 mph
around 17 mph
24.50
25.51
29.9
Every consultation road with a published Council counter shows that the Council's own 7-day daytime mean is 2.8 to 8.1 mph higher than the figure quoted in the consultation. The day-mean and 85th-percentile columns above are read directly from row 67 column 21 and row 70 column 22 of each ATC site's published Speed Summary Two-Way sheet, so the comparison is between two figures the Council itself has published. The 7-day 24-hour 85th-percentile speed (one of the two commonly used measures of actual traffic speed listed in DfT Circular 01/2013 paragraph 36) is between 23.4 and 29.9 mph on every road. DfT Circular 01/2013 paragraph 100 says a 20 mph signing-only case is supported where the mean is at or below 24 mph. The Council's own means are at or near that threshold, so the policy direction is supportable; the 16 mph figure on the consultation page is what does not reproduce on the Council's own data.

Between 38% and 85% of daytime vehicles on these roads are currently above 20 mph and would be slowed by a 20 mph cap. The "no effect on journey times" claim is mathematically false on the Council's own data.

Roads in the consultation with no published counter: Clift House Road, Bishopsworth Road, Bedminster Down, Bedminster Down Road. The Council are making numerical claims about these without publishing the supporting data.

Full analysis in §8 of the consolidated Report v1.4, reproducible from code/all_consultation_roads.py. Download Report v1.4 (PDF) →

Key Finding (Part One, April 2026)

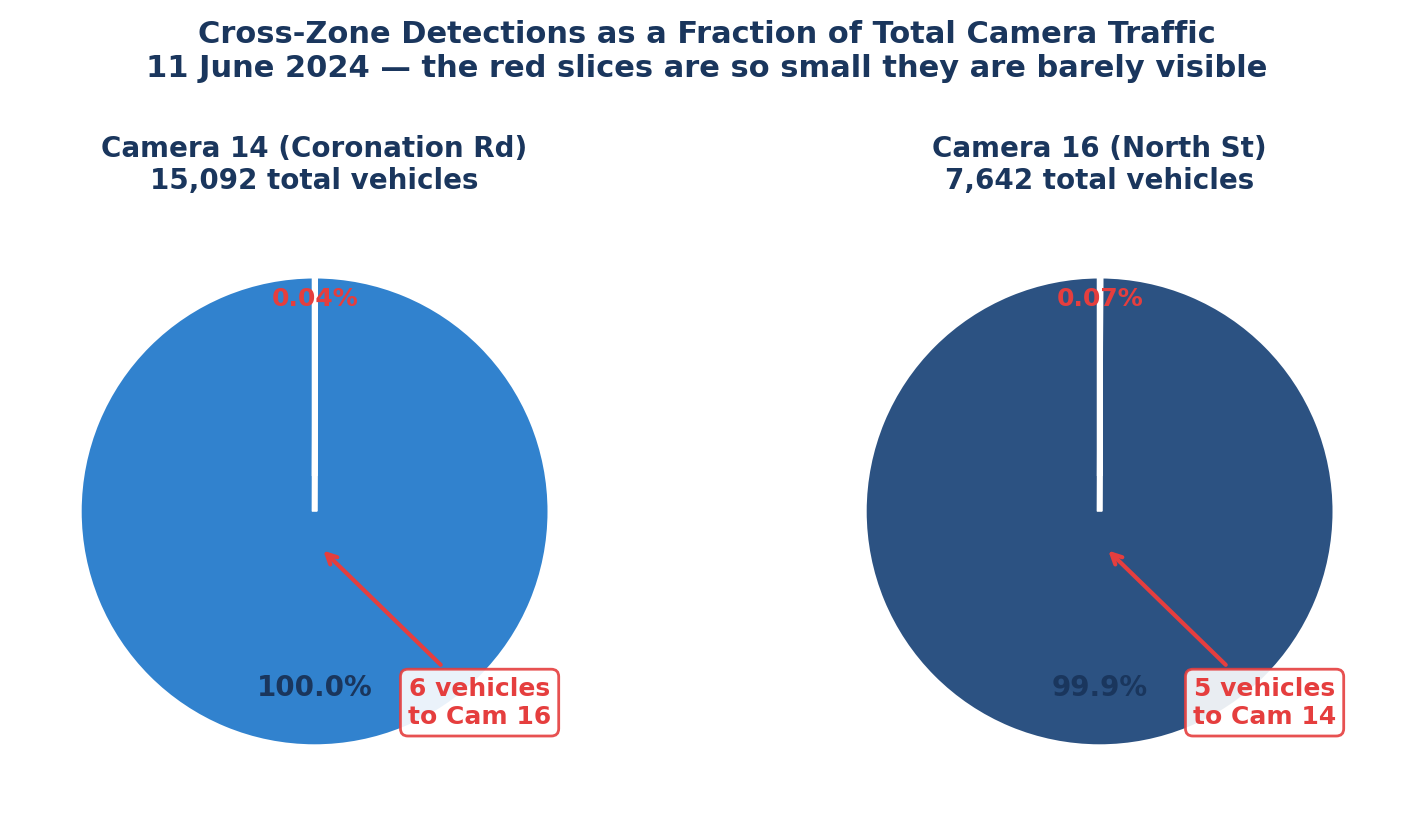
The June 2024 survey data does not contain evidence sufficient to demonstrate that vehicles are using Southville's residential streets as a cut-through between Coronation Road and North Street. The ANPR camera network had no cameras placed within the Southville zone. The two nearest cameras recorded only 10-11 vehicles per day appearing at both locations, representing approximately 0.07-0.14% of the traffic at those cameras.
The Numbers, Part One

25
ANPR cameras deployed across South Bristol. None within the Southville Zone.
15,092
vehicles detected at Camera 14 (Coronation Road) on 11 June 2024.
11
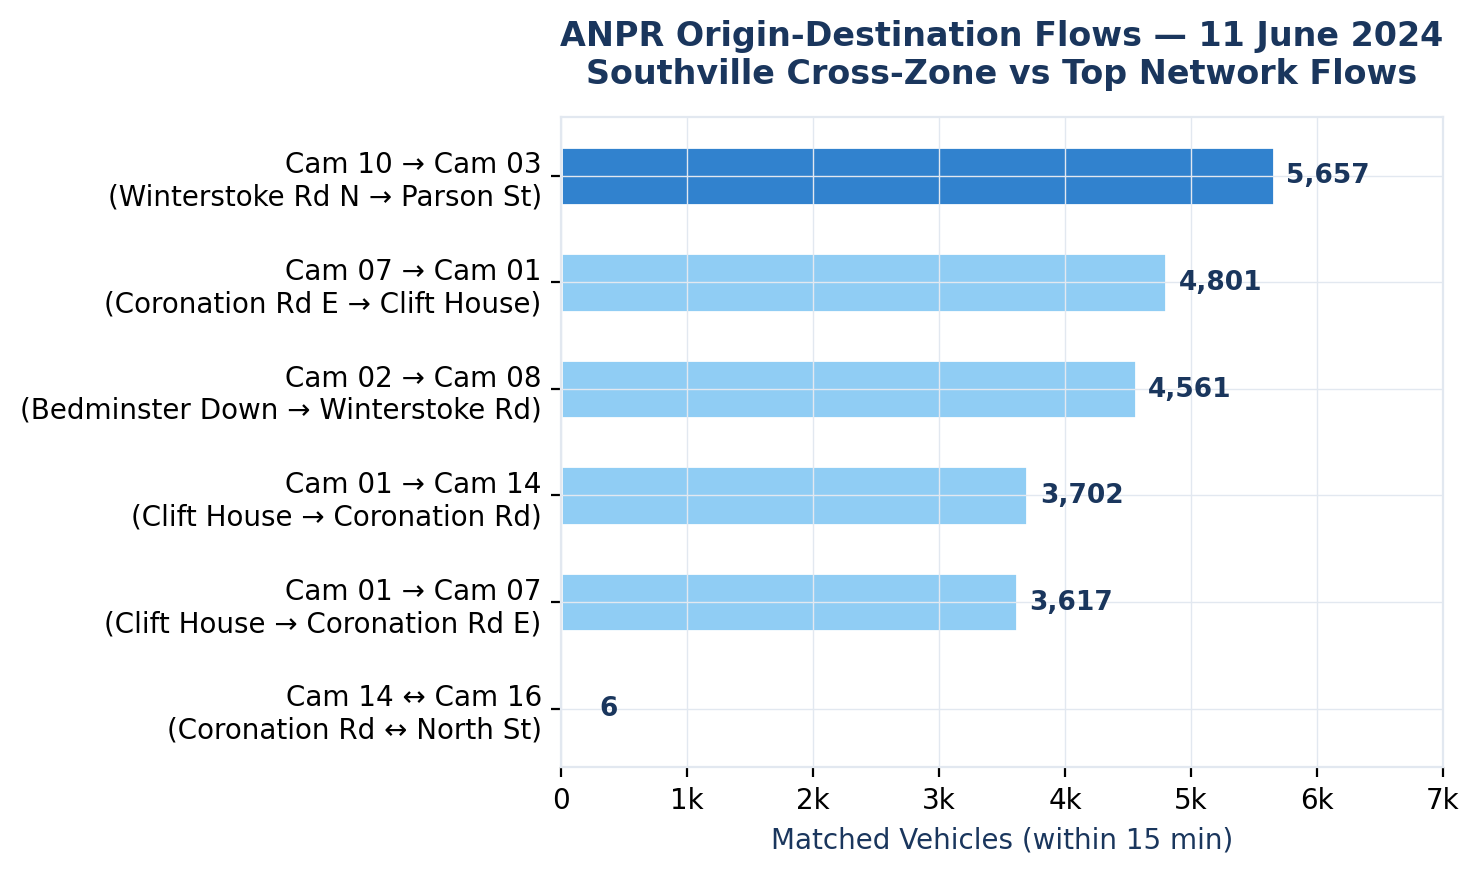
vehicles detected at both Camera 14 and Camera 16. That's the entire cross-zone count.
90%
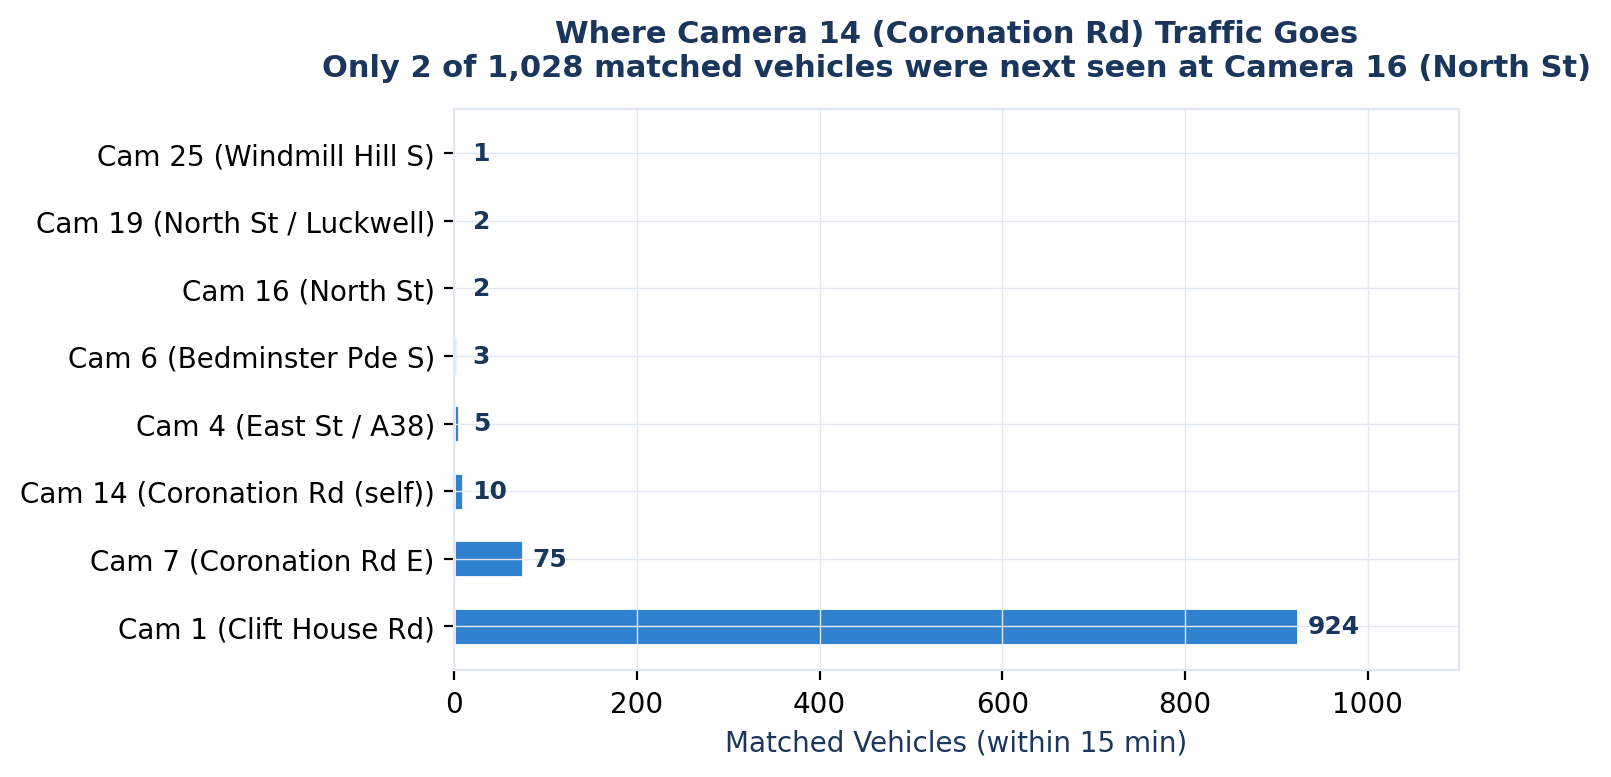
of Camera 14 traffic went to Camera 1 (Clift House Road) — along the corridor, not through Southville.
45%
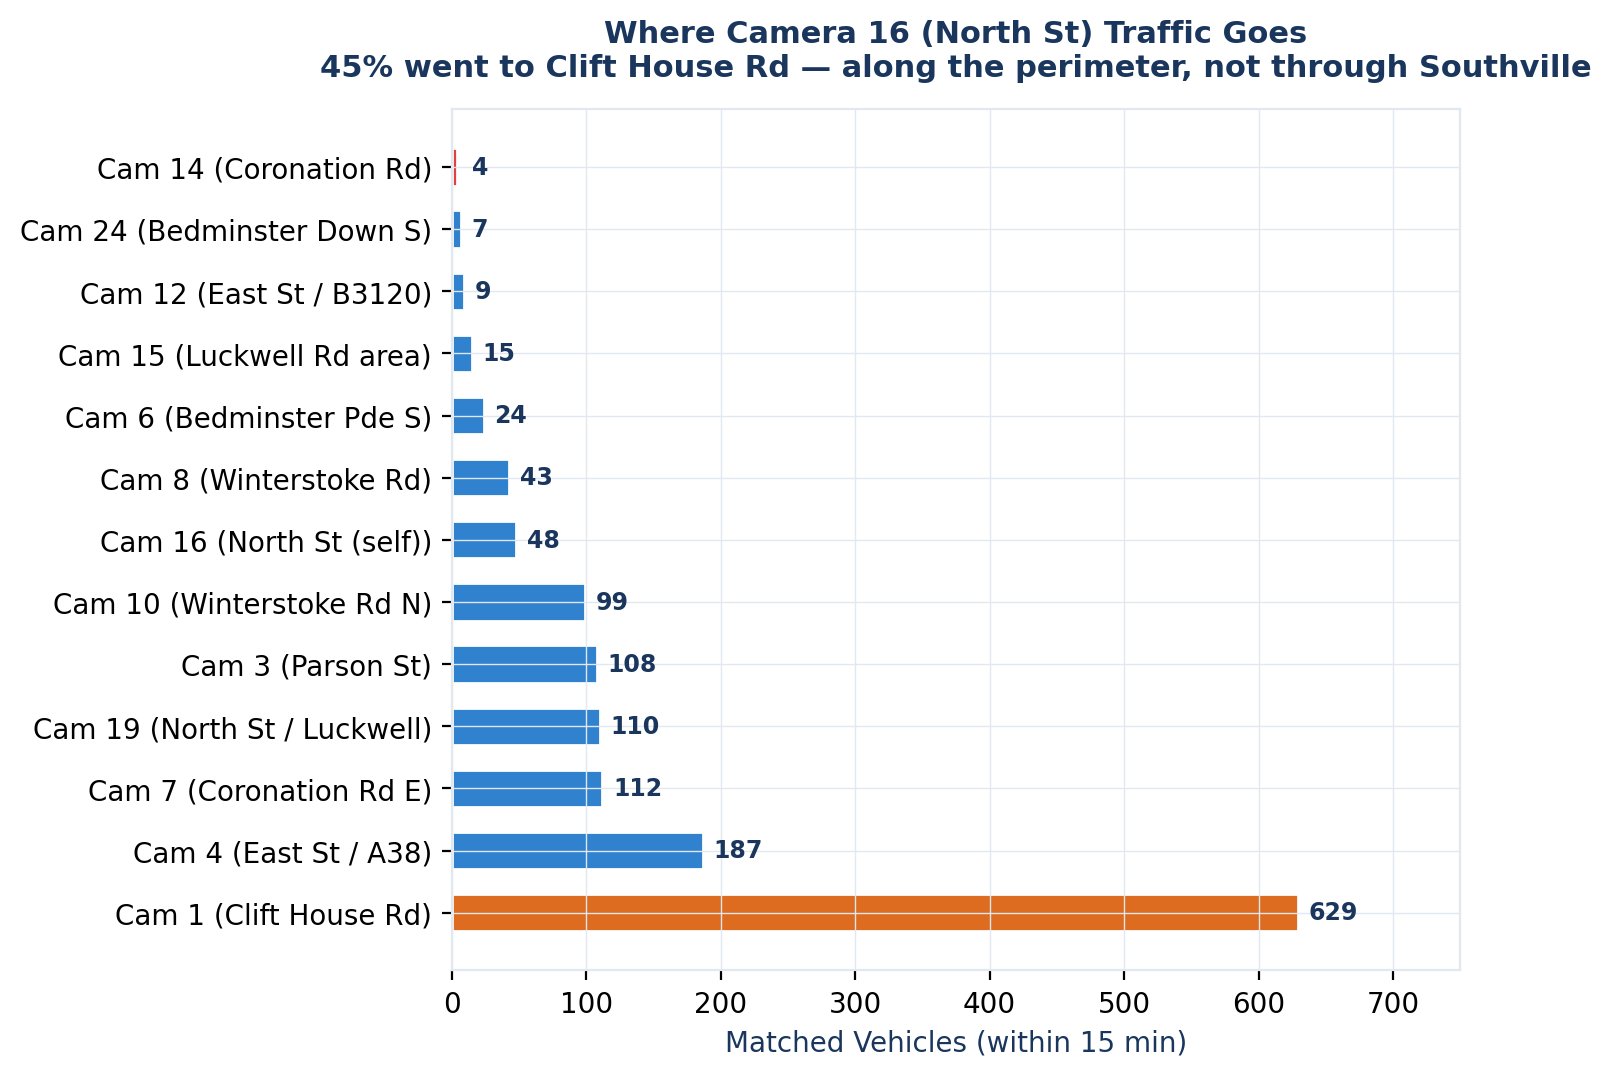
of Camera 16 traffic also went to Clift House Road — along the perimeter of the Southville Zone.
94%
of Luckwell Road traffic can be explained by local residential demand, schools, deliveries, and visitors.

Visual Evidence, Part One

Pie charts showing cross-zone detections as fraction of total traffic
Cross-zone detections as a fraction of total camera traffic. The red slices are so small they are barely visible.
Camera 14 destination breakdown
Where Camera 14 traffic actually goes. 90% travelled to Clift House Road along the corridor.
Camera 16 destination breakdown
Where Camera 16 traffic actually goes. 45% went to Clift House Road along the perimeter.
Dominant ANPR flows vs cross-zone
The cross-zone flow (6 vehicles) compared to the dominant corridor flows (3,600-5,600 vehicles).

Download Part One

The complete April 2026 analysis with all charts, maps, tables, and methodology.
All source code and data processing scripts are open source on GitHub.

Download Full Report Part One (PDF) Executive Summary (PDF)
Part Two · in detail · 7 May 2026 · Preliminary draft

How we know: the full analysis behind the headline numbers.

The summary at the top of this page is supported by four detailed sections below: a side-by-side comparison of Arup's and Floow's competing definitions of "through traffic", a worked Upper Sydney Street example, a glossary of every technical term, and a section per Council dataset.

The whole story in 60 seconds

The Council says "high numbers of vehicles cut through Southville". That phrase has to mean something specific before it can be tested against data. There are two reasonable definitions of "through traffic" in circulation, and the Council's own consultants used different ones, without telling readers which.

Definition A · used by Arup (Nov 2024)

"Trips not made by residents or visitors"

A vehicle is "through" only if its driver had no reason to be in the area, they're just passing through it.
🏠Resident driving home from workLOCAL
📦Delivery van going to a houseLOCAL
👥Friend visitingLOCAL
🚗Stranger using a residential street as a shortcutTHROUGH
Definition B · used by Floow (Jul 2025)

"Both endpoints outside this small zone polygon"

A vehicle is "through" if its journey started AND ended outside an arbitrary zone polygon, even if the driver lives on the road.
🏠Resident from outside the polygon, driving homeTHROUGH
📦Delivery van from a depot outsideTHROUGH
👥Friend visiting from another postcodeTHROUGH
🚗Stranger using a residential street as a shortcutTHROUGH

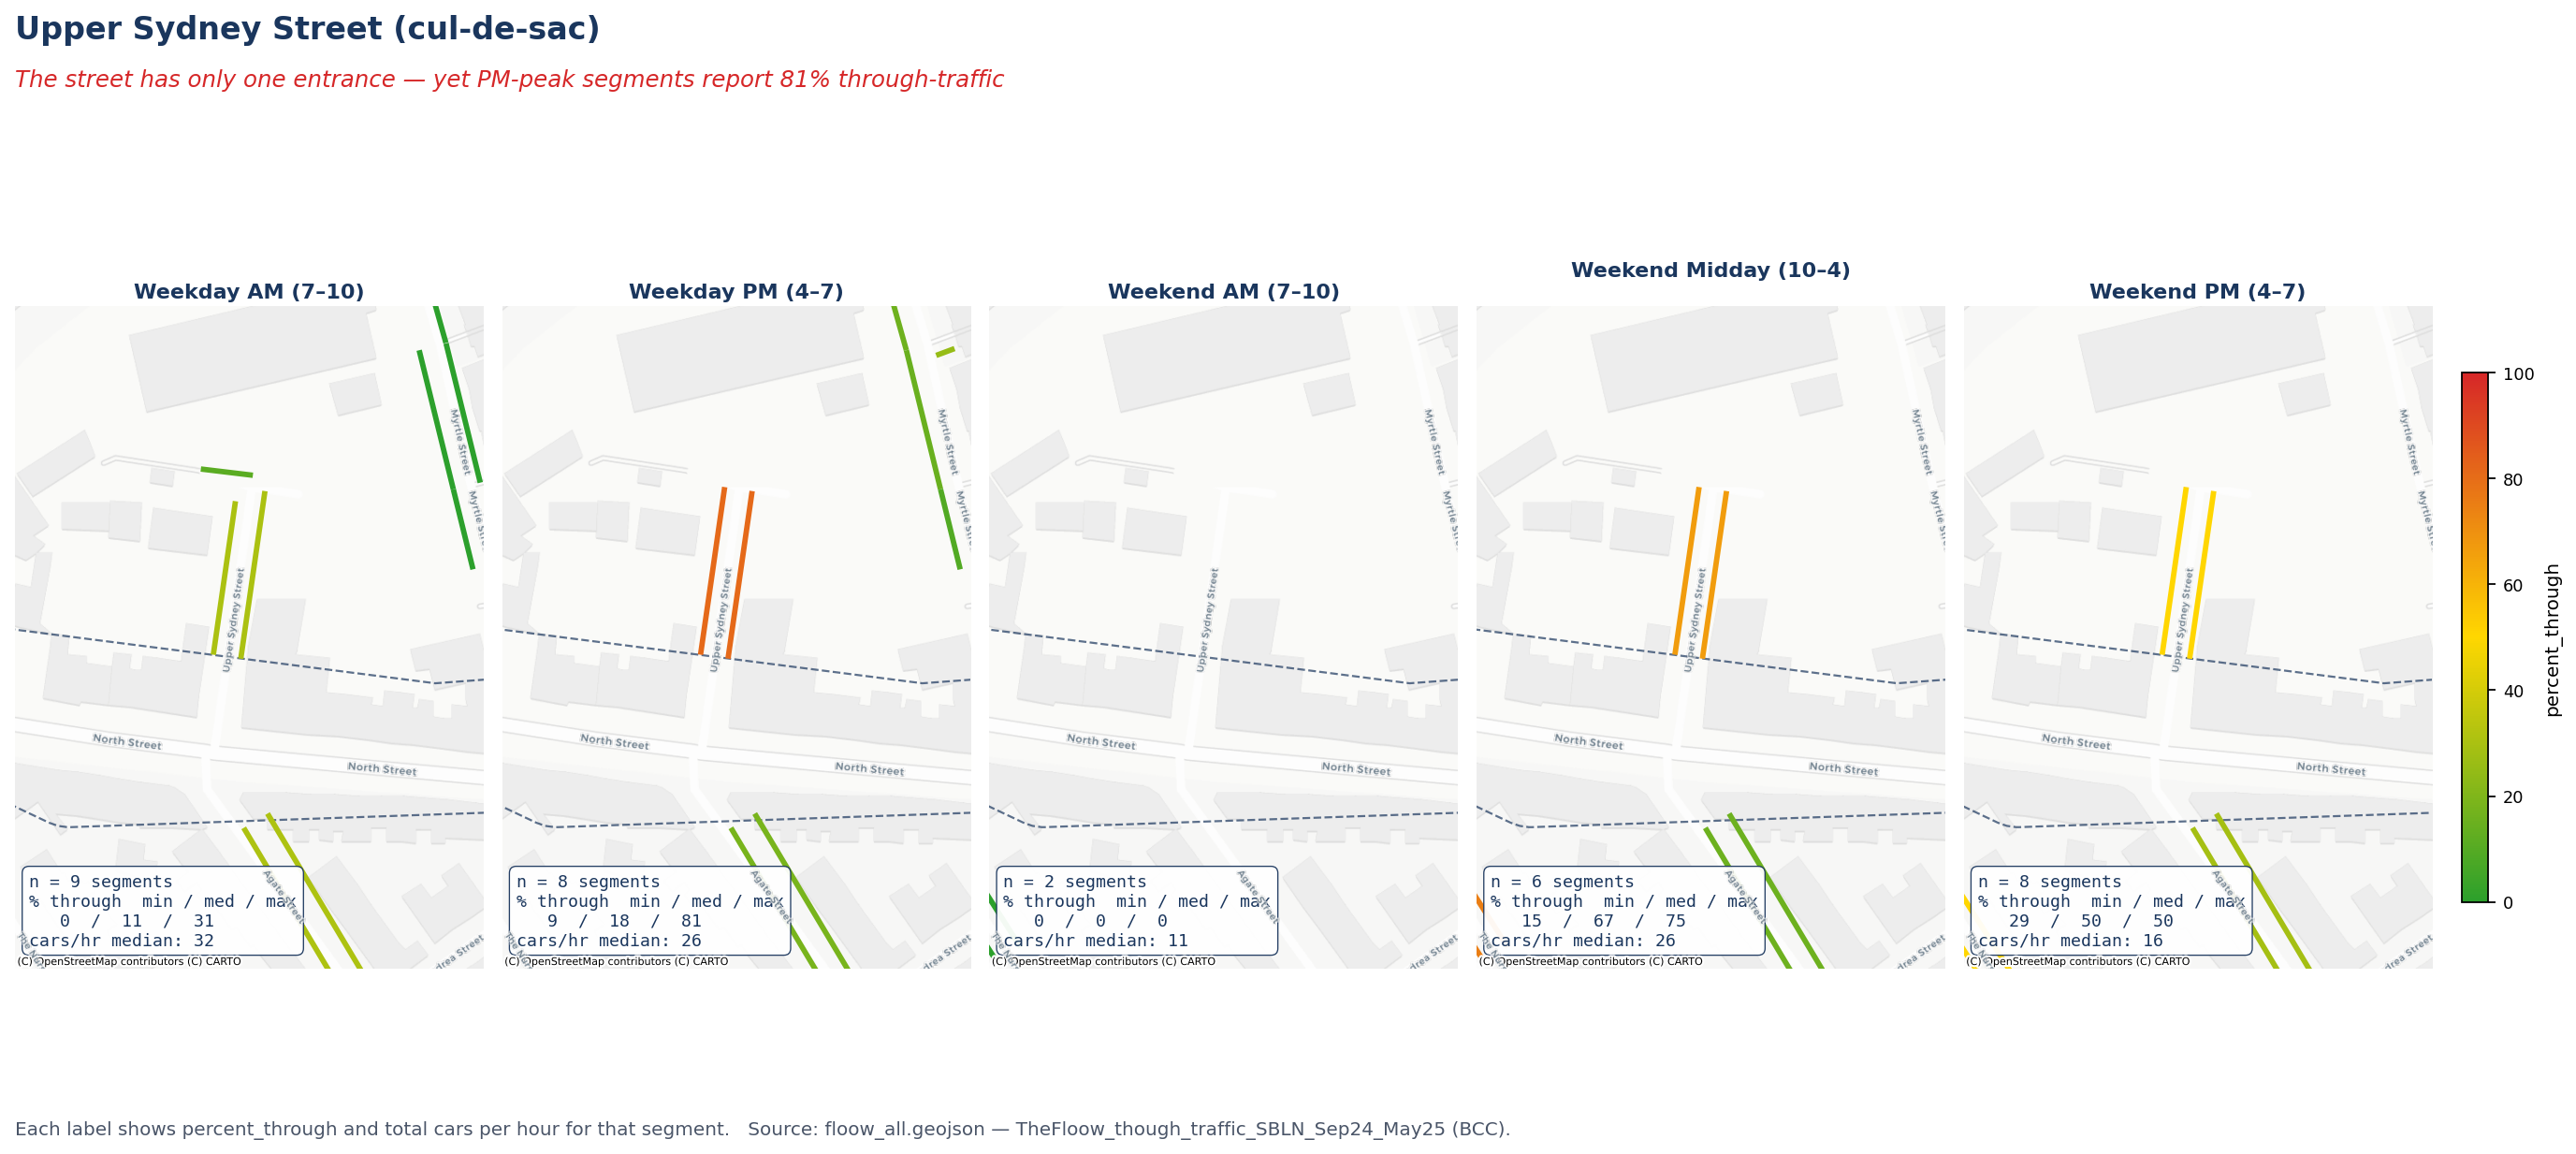
Same word. Different rules. Different results. Under Arup's definition, Southville's through-traffic was 10 to 13% (their own number, marked "upper-end"). Under Floow's definition, the headline number can hit 81%, even on a cul-de-sac that physically has no through-traffic, because the rule isn't about the road, it's about the polygon.
Worked example: how Floow turns a cul-de-sac into "81% through"

1
The street. Upper Sydney Street is a short cul-de-sac (~50 m) off Greville Road. It has one entrance. No vehicle can drive into it and out the other end, because there is no other end.
2
What Floow's data says. In the Weekday PM peak (4 to 7pm), the Floow layer reports 81% through-traffic on Upper Sydney Street, on a base of about 16 cars per hour total.
3
How that's possible. Floow classifies each car by where its journey started and ended, not by what it did on the street. Most cars on Upper Sydney Street are residents and visitors arriving from elsewhere. If their start or end address is outside the small SBLN sub-zone polygon (which, with GPS noise of a few metres at the polygon edge, often happens by accident), the trip is labelled "through", even though the car came in, parked at a house, and later left the same way.
4
The actual number of cars cutting through. Zero. It's geometrically impossible.
This is the methodology that produced the "85% on Raleigh Road" headline. The same rule that turns a cul-de-sac into 81% applied to a normal residential street turns ordinary residents driving home into "through traffic". Open the interactive map and click any cul-de-sac segment to verify this directly.

What every term means

ANPR camera
Automatic Number Plate Recognition camera. A fixed camera that records the number plate, time, and direction of every vehicle passing it. The June 2024 SBLN survey deployed 25 of these around the SBLN study area, but none inside the Southville Zone.
The Floow
A telematics company. Their dataset doesn't see number plates; it sees anonymous GPS traces from vehicles whose owners use a connected app or insurance device.
Telematics
Vehicle GPS data, sampled at intervals. Knows where a journey started and ended (within GPS error of a few metres) and which roads were used.
"Through traffic" (Arup version)
Trips not made by residents or visitors. Verbatim from the Arup glossary, page 1. This is the common-sense reading of "cut-through".
"Through traffic" (Floow version)
Trips whose start AND end addresses are outside a small SBLN sub-zone polygon. Has nothing to do with whether the car drove the whole length of any road.
SBLN zone polygon
A small area drawn on a map. The Council uses 10 such polygons in the published zones layer; the Floow data refers to 12 zone codes, so two polygons exist that the public cannot see. The polygons carry no name field, only ID numbers.
Segment
One row of the Floow data, a short directional piece of road, typically 6 to 60 metres long. A normal residential road has many segments; the percentage is reported on each one separately.
percent_through
The Floow number that's been reported as "85%" or "81%". Share of vehicles on a segment whose journey endpoints both lie outside the local SBLN zone polygon.
percent_internal
Trips that started AND ended inside the local SBLN zone polygon.
percent_inbound
Trips arriving from outside the zone, visitors, deliveries, residents returning home.
percent_outbound
Trips leaving the zone for elsewhere.
estimatedCarsPerHour
Total vehicles per hour through the segment, regardless of category. The absolute number that "85%" is taken of. Often surprisingly small, typically 30 to 60 on residential streets.
Bristol CC website
Sept 2025
"high numbers… cut-through"
No definition or numerical reference given.
Arup ANPR analysis · BCC-commissioned
Nov 2024, withheld for 17 months
10 to 13% in Southville
Upper-end estimate. Definition: "trips not made by residents or visitors". Arup themselves: "does not appear to make up a large proportion of all traffic."
The Floow telematics · BCC-commissioned
Jul 2025 (covers Sept 2024 to May 2025)
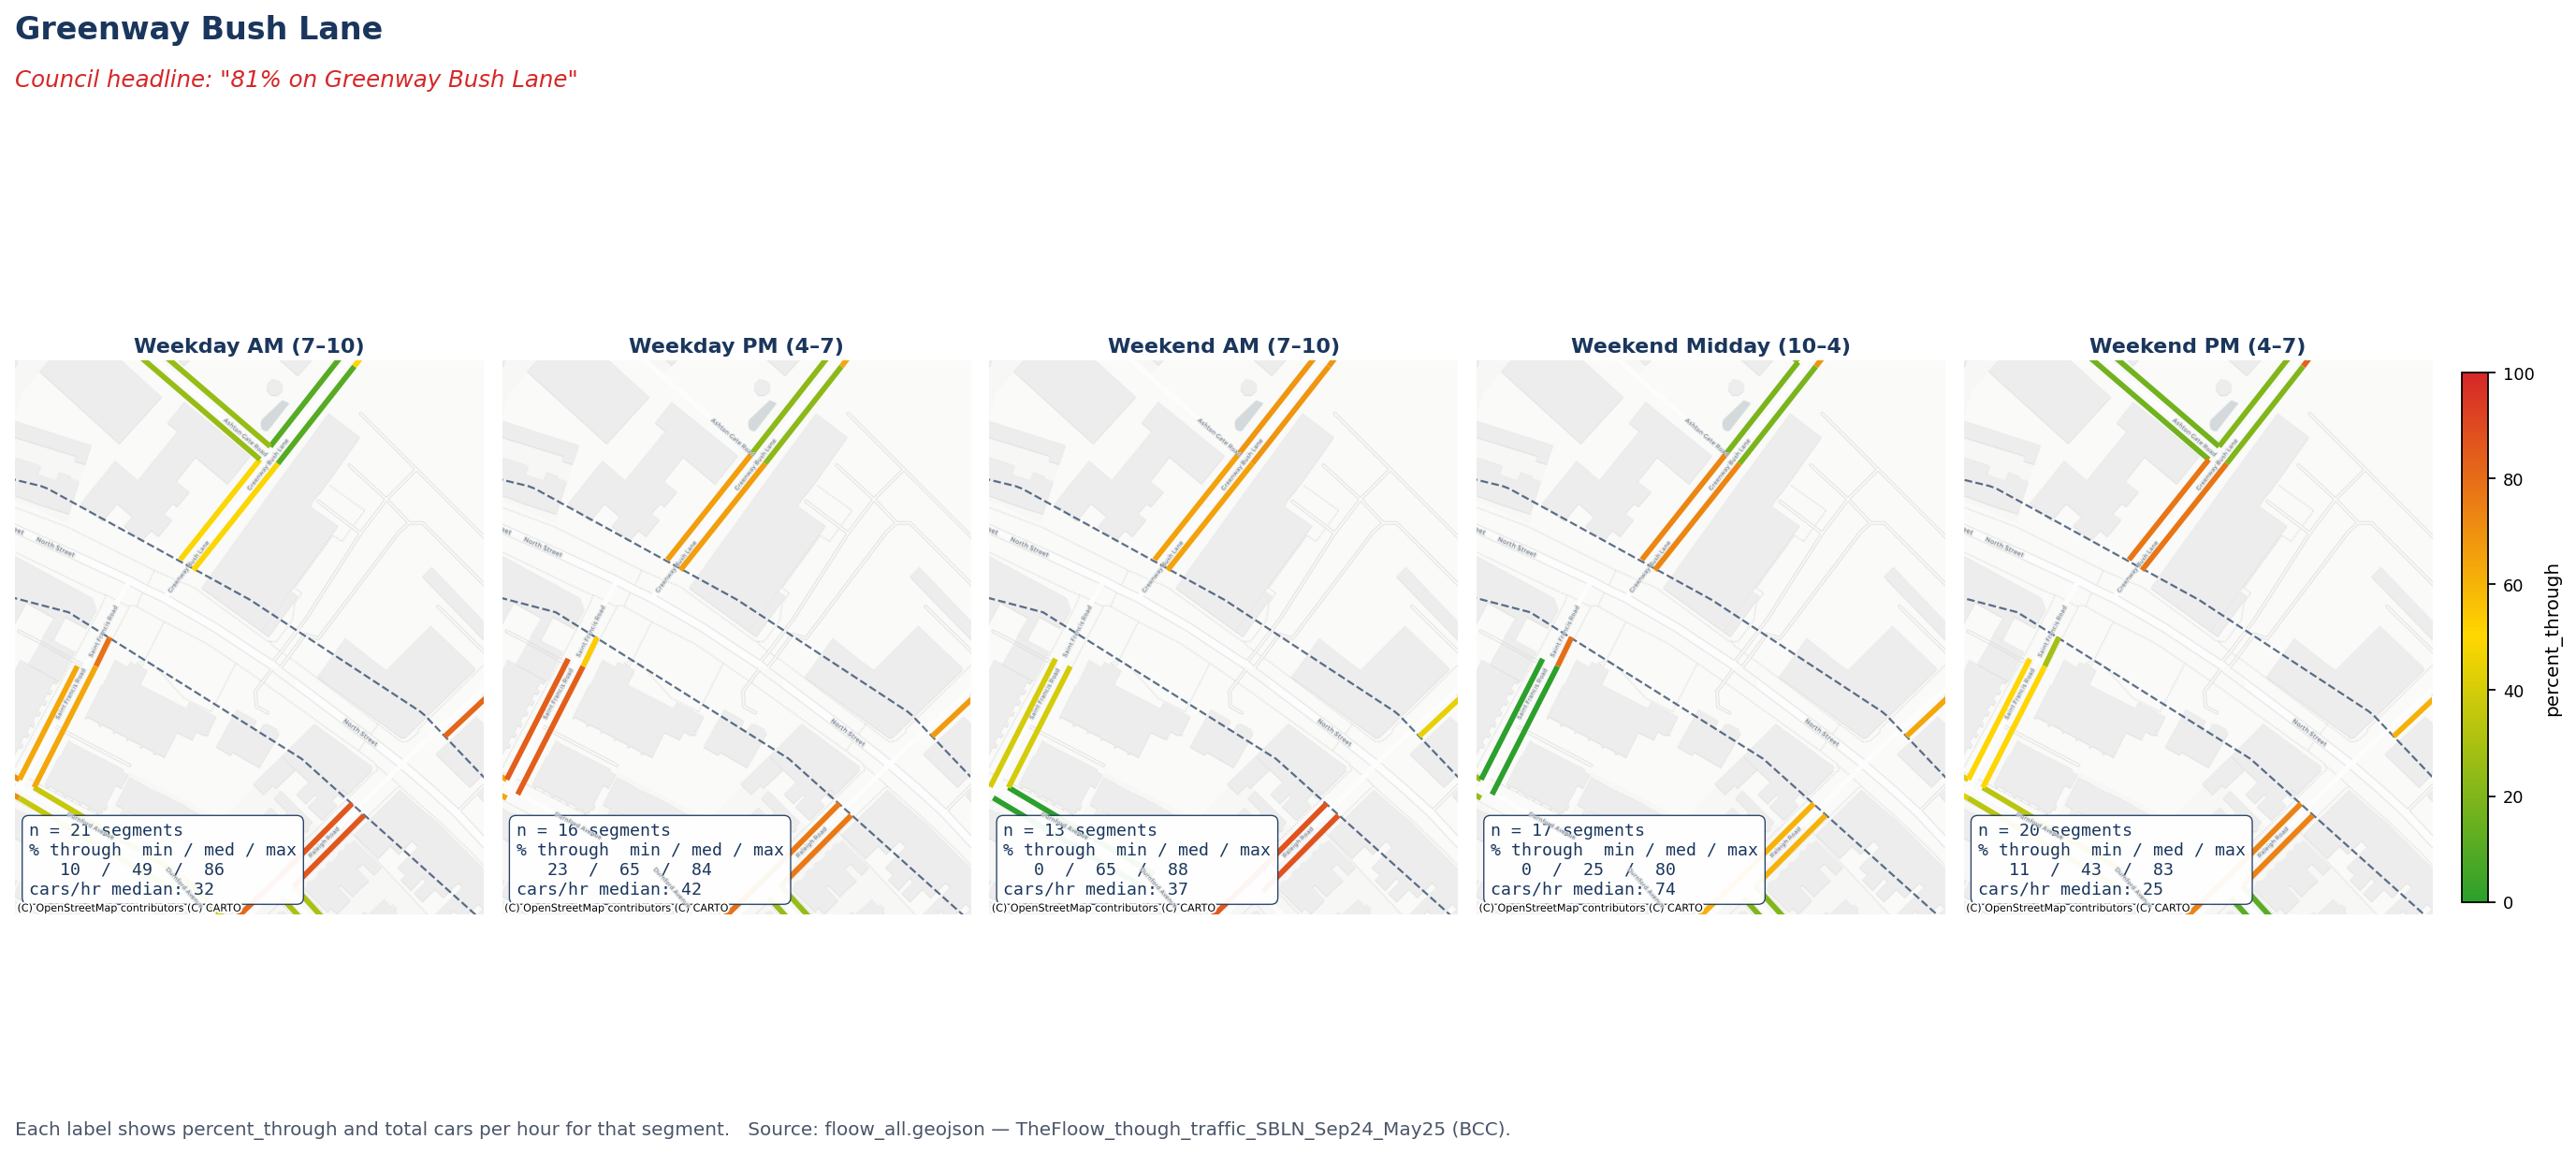
Up to 85% on Raleigh Rd / 81% Greenway Bush Ln
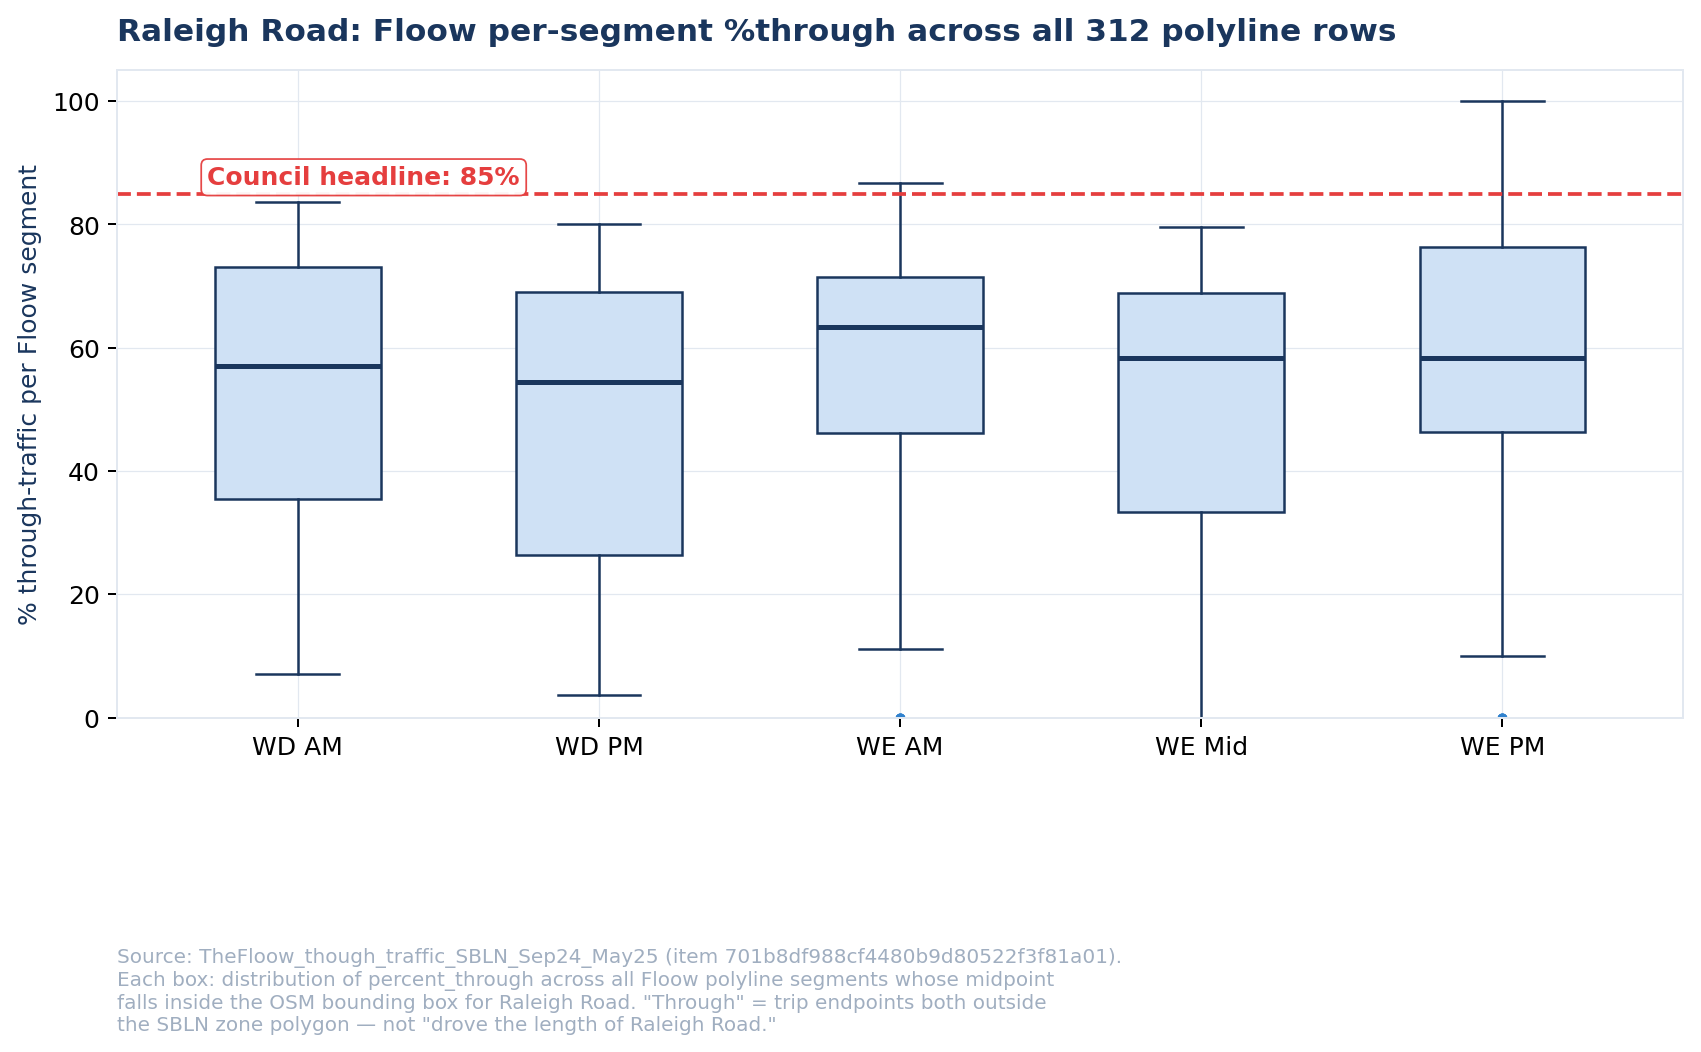
Single-segment-and-period maxima. Road-wide medians 49 to 74%. Through cars/hr per segment: 15 to 28. Definition: trip endpoints both outside the local zone polygon, not "drove the length of the road".
Independent ANPR cross-check
Apr 2026 · this report, Part One
0.07 to 0.14%
Vehicles seen by both Camera 14 and Camera 16 within the same 15-minute window, June 2024.
Reconciliation table
Five sources, five definitions, five different headlines, none of which support "high numbers".

1Arup, Area-level through traffic analysis (Nov 2024)

Source: Arup Through Traffic Analysis.pdf, published by the Council on bristol.gov.uk but never cited in any public-forum response from November 2024 until May 2026. Sector 5 = Southville.
"Whilst there is some variance across the study area, at a sector level through-traffic does not appear to make up a large proportion of all traffic." , Arup Through Traffic Analysis, p. 3 (verbatim)
"No exclusion of 'long' through trips… or of mismatches… Both of these exclusions make the through-traffic percentage estimates upper end estimates." , Arup Through Traffic Analysis, p. 3 (verbatim)
Arup through-traffic by sector
Arup Table 2 visualised. Southville highlighted. Numbers are Arup's own, lifted directly from the PDF.

Worst case Arup identifies anywhere in the SBLN study area: 229 vehicles per AM peak on Palmyra Road westbound, about 1.3 vehicles per minute. Palmyra Road is in Sector 4. It is not Southville.

2The Floow, telematics layer (Jul 2025)

Source: BCC ArcGIS Web Experience, FeatureServer item 701b8df988cf4480b9d80522f3f81a01. Local copy: data/floow/floow_all.geojson, 4,866 polyline rows × 12 attributes. The full layer is now driveable directly in your browser:

The Floow through-traffic explorer

Switch between the five published time periods. Recolour by any of the four percentage fields or total cars/hour. Toggle SBLN zones. Click any segment to see its full record.

Open the interactive map →

What the data actually measures: percent_through is the share of vehicles whose journey endpoints both lie outside the local SBLN zone polygon, not "the share of vehicles that drove the entire length of the road". Two consequences:
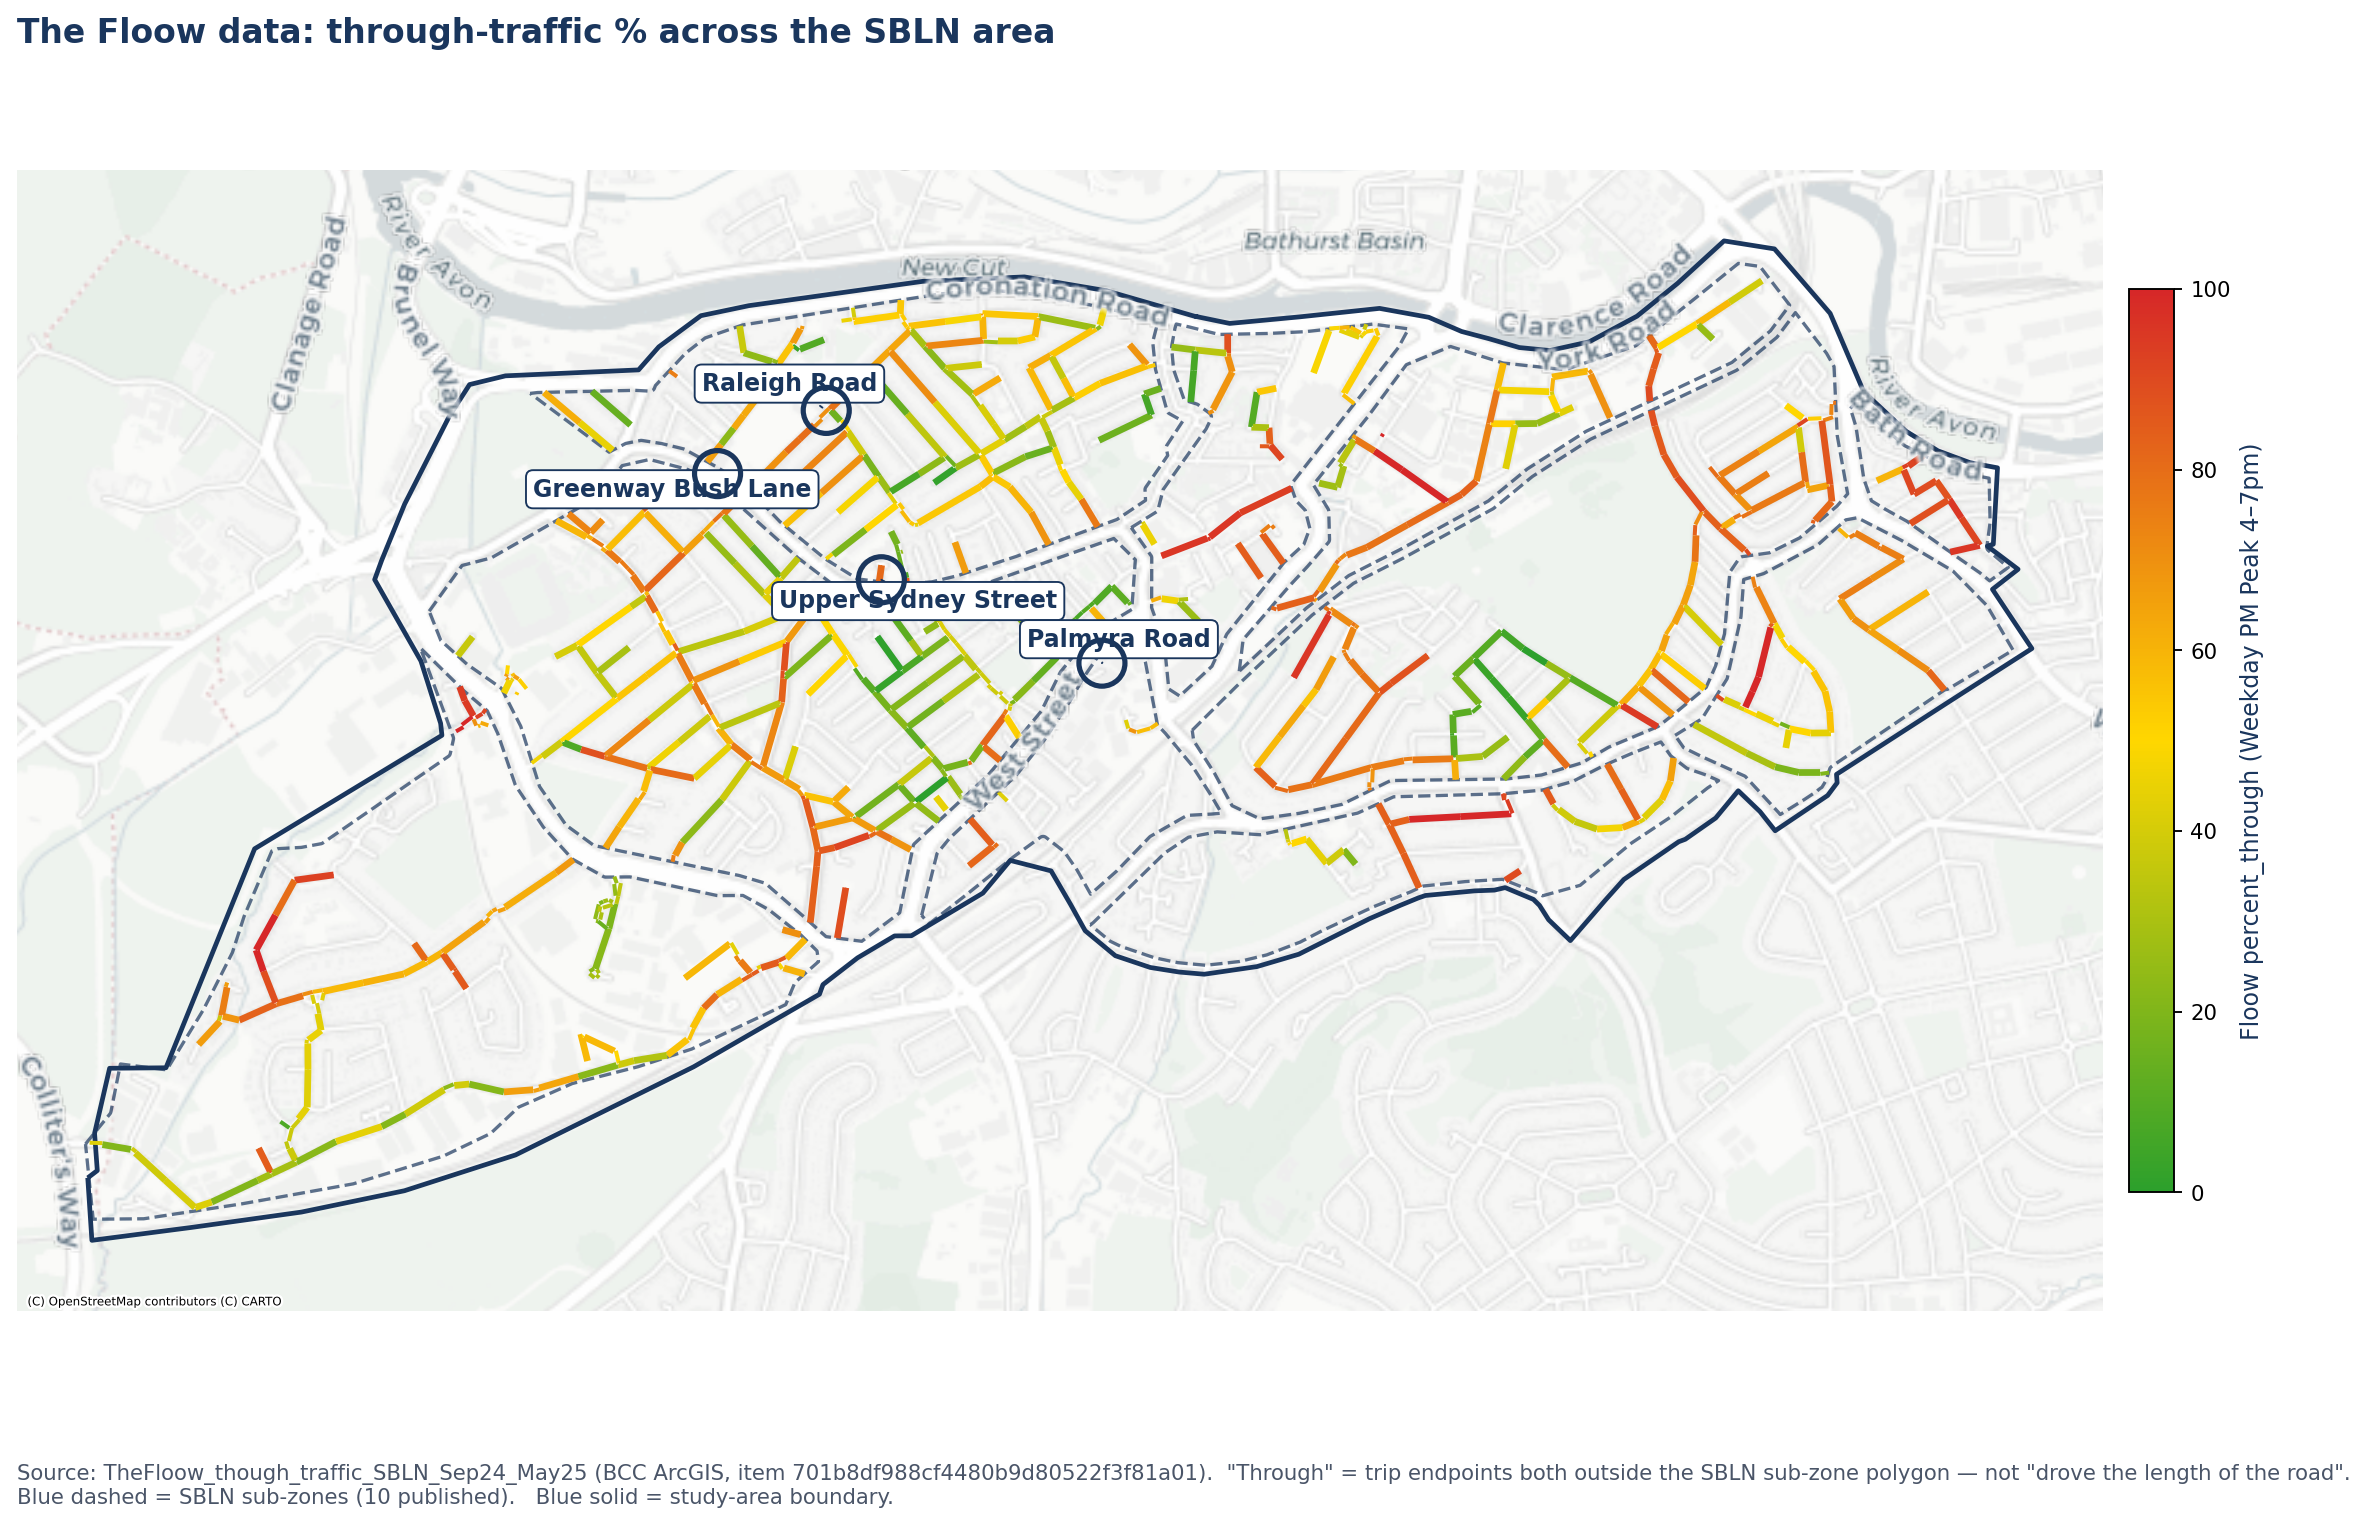
Floow overview map
The Floow data, Weekday PM Peak. Each polyline is one directional segment, coloured by percent_through. Blue dashed = SBLN sub-zones; blue solid = study-area boundary. The four named roads are circled.
Raleigh Road percent_through distribution
Distribution of percent_through across all 312 Raleigh Road polyline rows, by time period. The 85% headline is the upper outlier; the road-wide median is 54 to 63%.
Raleigh Road segment close-up
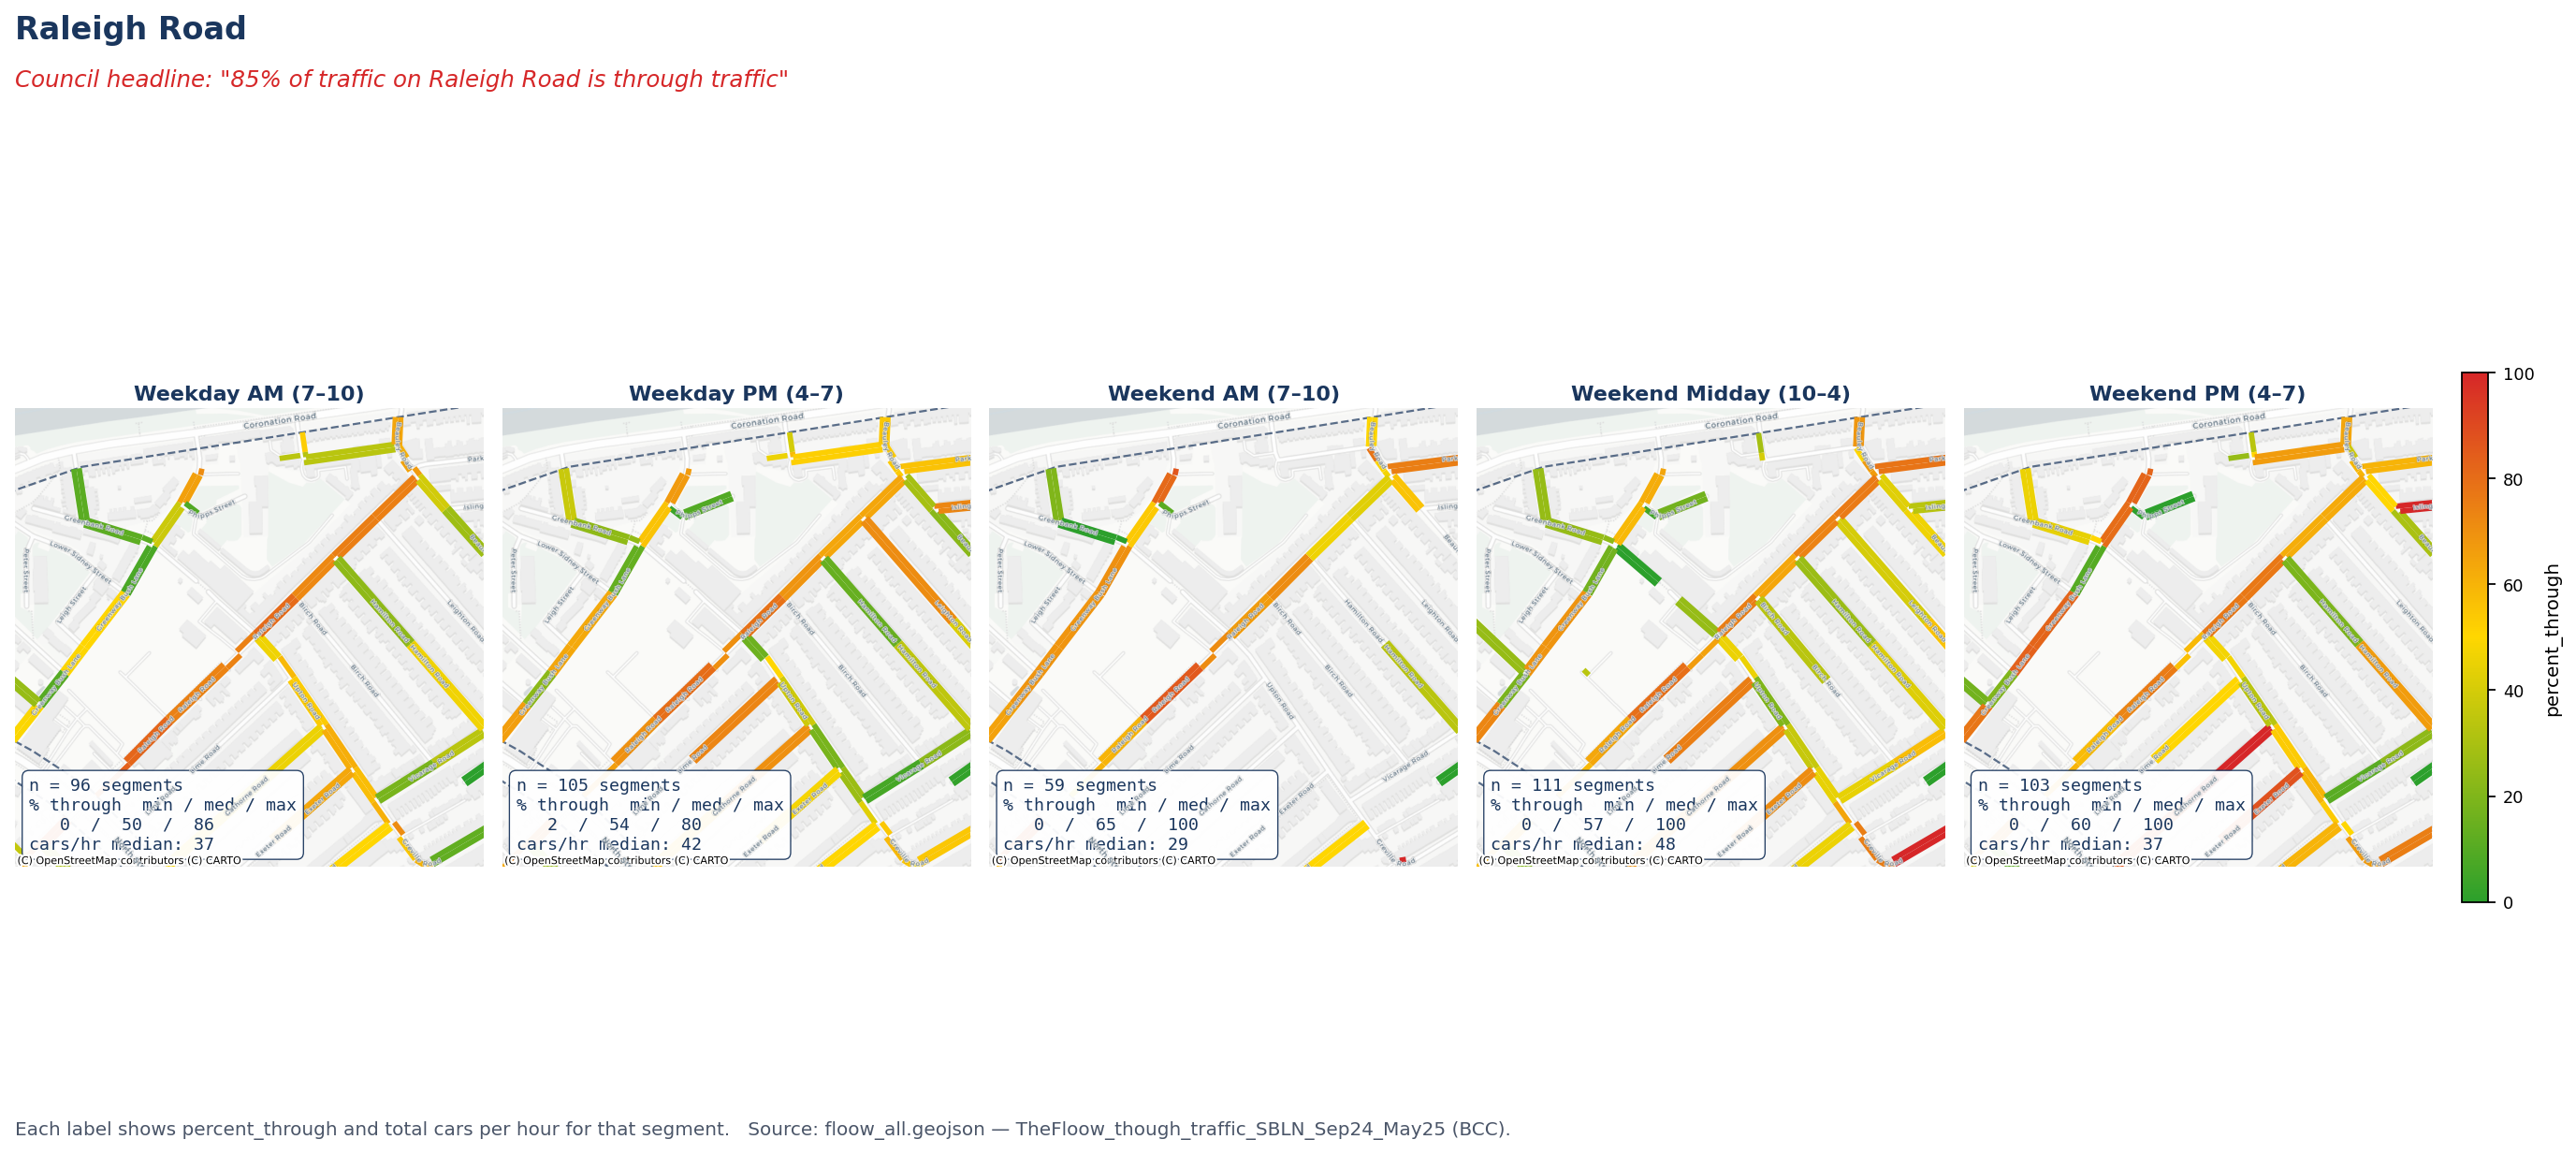
Raleigh Road close-up across all five published time periods. Each label shows percent_through and total cars per hour for that segment.
Upper Sydney Street segment close-up
Upper Sydney Street close-up. The street is a cul-de-sac with a single road entrance from Greville Road; physically through-traffic is impossible. Yet Floow's PM-peak segments report 81%.
Greenway Bush Lane segment close-up
Greenway Bush Lane close-up. The Council headline of 81% is neither the maximum nor the road-wide median.
Zone polygon inconsistency
The 10 published SBLN zone polygons. The Floow data references 12 distinct zone codes (10, 11, 12, 13, 14, 18, 38, 47, 48, 49, 55, 57); two are not visible to the public. Polygons carry no name field, only OBJECTID, residents cannot tell which zone their address is in.

3"December 2025" / Autumn 2025 surveys

Source: data/SBLN-December-2025-Traffic-Surveys.zip (402 MB, 122 spreadsheets); summary layer data/floow/sbln_traffic_count_extents_autumn2025.geojson (102 segments).

The Council page describes this dataset as "December 2025 Traffic Surveys"; the underlying FeatureServer layer name records it as 2025-10-30-SBLN-before-counts-Autumn-2025; the spreadsheet filenames inside the zip are tagged "Nov 25". On any reading the surveys were conducted in autumn 2025 (Oct/Nov), not December 2025.

The dataset has no through-traffic field. It carries Av_7day_total_Vehicles, Av_7day_speed_mean, Av_7day_speed_85thPercentile, walking, cycling, and nothing else. It is a volume-and-speed dataset. It cannot, by construction, support a through-traffic claim. And for separate reasons it cannot retroactively justify the September 2025 claim either: the data was not collected until after that claim had been made.

Master reference and two standalone audits

The complete consolidated analysis is the master reference document, drawing on every Council claim, every dataset, and the Excel database. The two standalone audits are derived from it, each focused on one issue so it can stand alone on its own news cycle.

Master reference (complete analysis)

Consolidated audit, v1.4 (PDF)

Issue-specific audits (drawn from the master)

SBLN through-traffic audit (PDF) 20 mph speed-limit audit (PDF)

Shared evidence base

Excel database (all numbers, long form) Interactive Floow explorer Source code on GitHub